
Local Rate of Change of a Parabola (Approximating Tangent Slope)
Loading the math board and drawing, please wait…
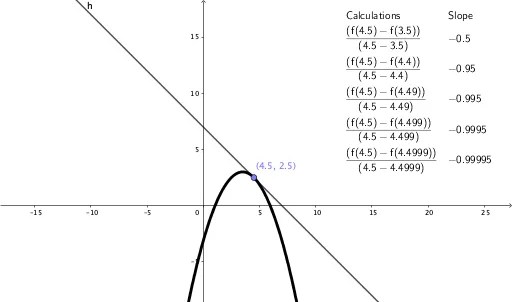
This GeoGebra example demonstrates the local rate of change (derivative) of a parabola at a point through successive approximations. The core mathematical concept is the definition of the derivative: the tangent slope is obtained as the limit of secant slopes as the second point approaches the point of interest. Construction highlights: using the Tangent command to draw the tangent line at point A, the Sequence command to generate a series of secant lines connecting A to nearby points B, and the TableText command to display a table comparing secant slopes with the tangent slope. By dragging point B or using a slider, learners can observe how the secant slope converges to the tangent slope as B approaches A. This resource is ideal for high school or introductory college calculus students to grasp the intuitive meaning of instantaneous rate of change, and serves well for classroom demonstrations or self-paced exploration.
GeoGebra Commands & Parameters
Tangent(C, f) → h,Sequence(g(x(C), x(C) - 10^(m)), m, 0, -4, -1) → l1Sequence("\frac{(f(" + ((x(C) * ") - f(")) + (((x(C) - 10^(m)) * "))}{(")) + (x(C)) + " - " + (x(C) - 10^(m)) + ")}", m, 0, -4, -1) → l2TableText(Join[{{"Calculations"}, l2}], Join[{{"Slope"}, l1}], "v") → text1
AI Drawing Prompt Reference
Draw a parabola opening upwards, then select any point A on the parabola and draw the tangent line at point A. Next, move a point B to the left from point A and draw the secant line connecting A and B, calculating its slope. As point B approaches point A, observe how the slope of the secant line changes until it gets close to the slope of the tangent line. Finally, create a table to show the comparison between the slopes of the secant lines and the tangent line.
The prompt above was compiled from the original drawing commands and is for reference only.