
Lissajous Curve Parametric Plot
Loading the math board and drawing, please wait…
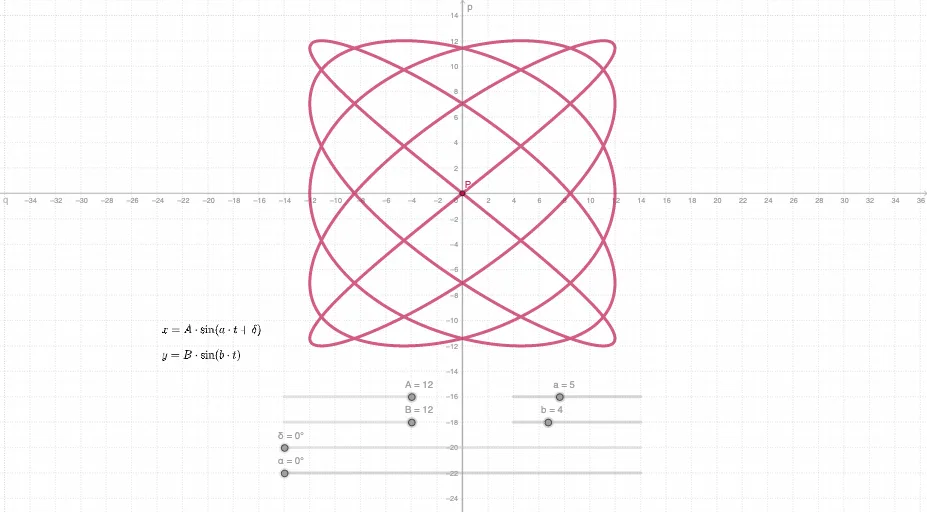
This GeoGebra example dynamically constructs Lissajous curves using parametric equations, visualizing the superposition of two harmonic oscillations with adjustable frequency ratio, amplitude, and phase difference. The construction employs GeoGebra commands such as Intersect, Locus, and slider-controlled parameters (a, b, α, δ) to generate the curve’s locus in real time. It serves as an excellent resource for high school and early college mathematics, trigonometry, and physics courses exploring parametric functions, wave interference, and geometric loci. Users can interactively modify frequency and phase parameters to observe how the resulting curve transitions between simple ellipses and complex rosette patterns.
GeoGebra Commands & Parameters
Intersect(p, q) → PLocus(P, α) → c
AI Drawing Prompt Reference
Draw a parametric Lissajous curve. The curve is formed by superimposing two sinusoidal oscillations. Users can adjust frequency ratio, amplitude, and phase difference via sliders. Observe the curve transitioning from simple ellipses to complex rosette patterns. The drawing should clearly show the curve's path and intersection relationships.
The prompt above was compiled from the original drawing commands and is for reference only.