
Linear Inequalities Slider
Loading the math board and drawing, please wait…
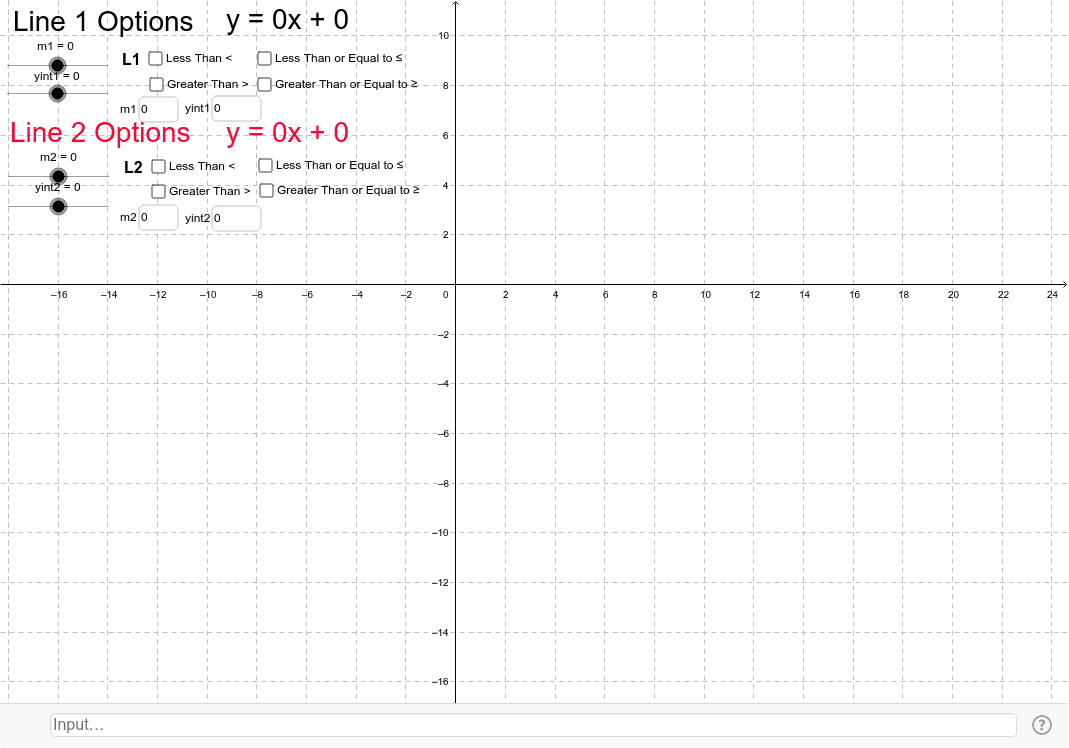
This example demonstrates the graphical representation of linear inequalities. Key mathematical concepts include linear inequalities and their solution sets. By using GeoGebra's slider feature, users can dynamically adjust the coefficients of the inequalities and observe their effects on the graph. The construction summary mentions the use of Textfield, objects, and InputBox commands. Suitable for students in middle school and above to learn about linear inequalities.
GeoGebra Commands & Parameters
Textfield(m1) → InputBox1Textfield(m2) → InputBox2Textfield(yint1) → InputBox3Textfield(yint2) → InputBox4