
Characteristic of Discriminant in Quadratic Function Graphs
Loading the math board and drawing, please wait…
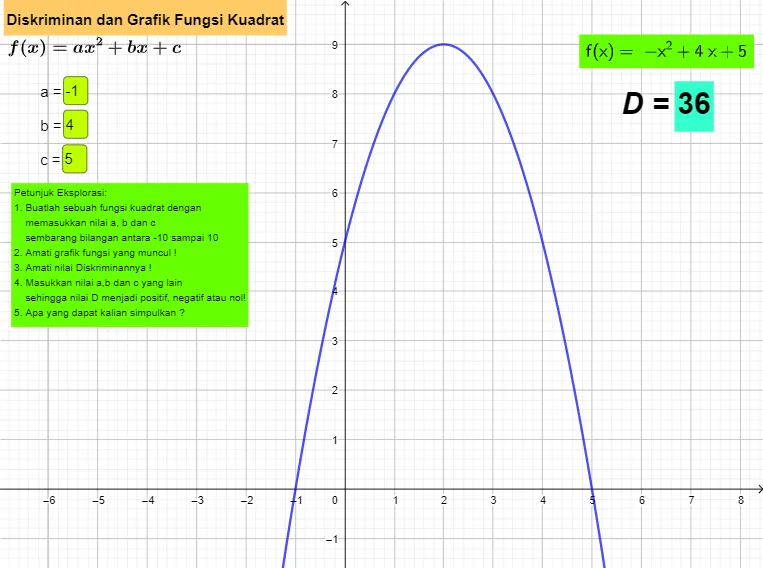
This GeoGebra example dynamically explores how the discriminant D=b²-4ac of a quadratic function y=ax²+bx+c determines the number of intersections between the parabola and the x-axis. The core mathematical concept is the relationship between the discriminant and the graph: D>0 gives two real roots and two x-intercepts, D=0 gives one tangent point, and D<0 gives no real intersections. The construction uses Textfield and InputBox objects to create three editable coefficient boxes for a, b, and c, along with text objects that display the computed discriminant and its interpretation. By changing the coefficients, learners can immediately see how the parabola shifts and how the discriminant value changes, reinforcing the algebraic condition visually. This is ideal for middle and high school students studying quadratic functions, discriminants, and graphical analysis, and can be used for classroom demonstrations or self-paced exploration.
GeoGebra Commands & Parameters
Textfield(a) → InputBox1Textfield(b) → InputBox2Textfield(c) → InputBox3
AI Drawing Prompt Reference
Create a dynamic illustration showing how the discriminant D=b²-4ac of a quadratic function y=ax²+bx+c determines the number of intersections between the parabola and the x-axis. Include three adjustable sliders for coefficients a, b, c, and text displays for the computed discriminant D and its interpretation. Visually represent the number of x-intercepts (two, one, none) based on the value of D (greater than, equal to, less than zero) to demonstrate the relationship between the discriminant and the graph.
The prompt above was compiled from the original drawing commands and is for reference only.