
Characteristics of Quadratic Function Graphs (2): The Role of Constant c
Loading the math board and drawing, please wait…
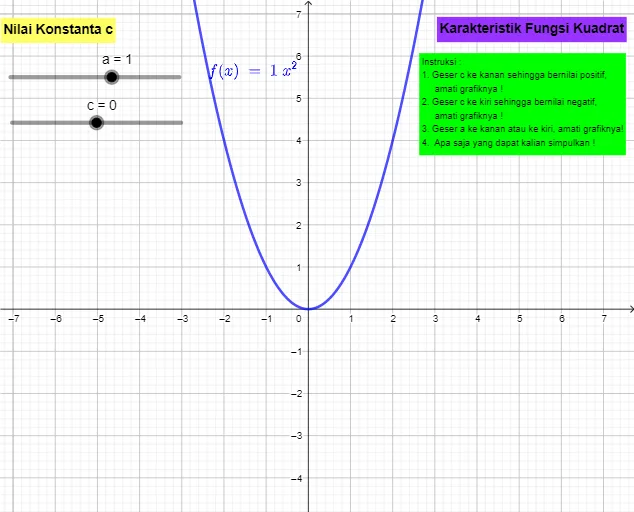
This GeoGebra example dynamically illustrates how changing the constant term c in a quadratic function y = ax² + bx + c shifts the parabola vertically along the y-axis. It focuses on the core concept that c determines the y-intercept of the graph, while the opening direction and axis of symmetry are governed by a and b. The construction uses sliders for parameters a and c, defines the quadratic function f, and employs text objects (text1, text2, text3) to display the current function expression, vertex coordinates, and y-intercept, making the effect of c visually explicit. This resource is ideal for middle and high school students learning quadratic function properties, as well as for teachers demonstrating parameter effects in class or for self-directed exploration.
GeoGebra Commands & Parameters
Numeric a(1)Numeric c(0)f(x) = (a * x^(2)) + c
AI Drawing Prompt Reference
Create a dynamic graph illustrating how changing the constant c shifts a quadratic function vertically. Include sliders for parameters a and c; let the function be y = f(x) = (a*x^2) + c, with the curve updating in real time as sliders move. Show the current function expression on the plot, and also display the vertex coordinates and the y-intercept as text values so that the effect of c on the y-intercept is visually explicit. Construct the setup by defining initial values for a and c first, then create the function and connect the text and graph to the parameters.
The prompt above was compiled from the original drawing commands and is for reference only.