
Linear Inequalities Slider: Dynamic Slope and Intercept Exploration
Loading the math board and drawing, please wait…
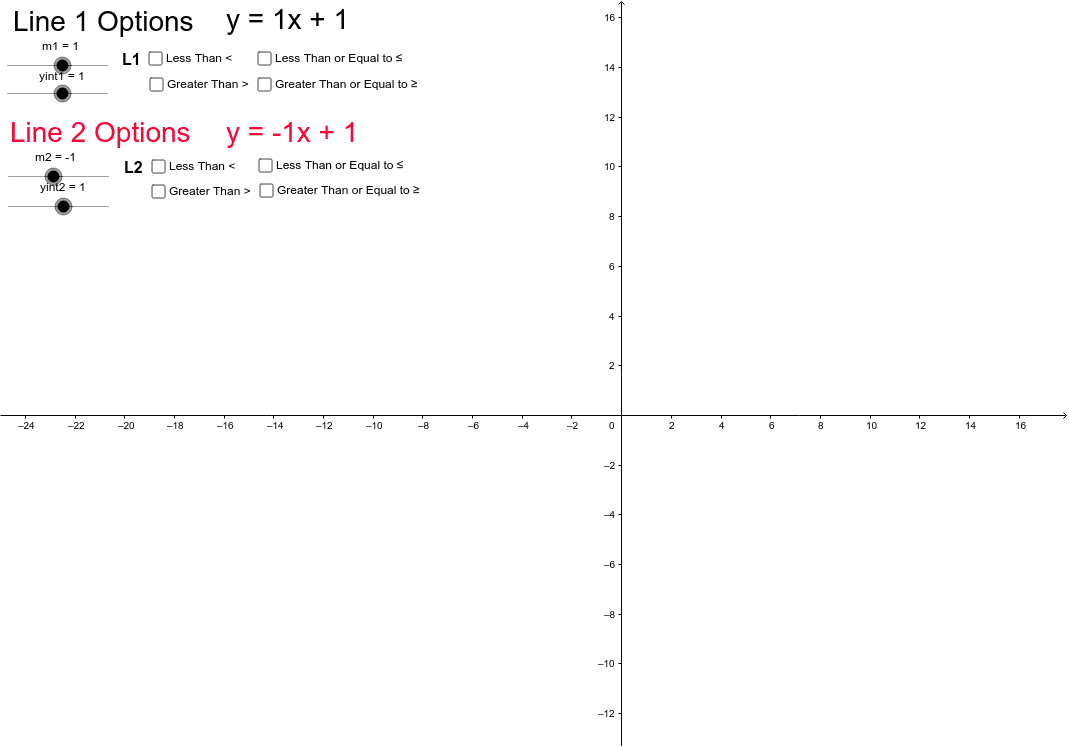
① This GeoGebra example uses sliders to dynamically adjust the slope and y-intercept of two lines, visually demonstrating how the solution set of linear inequalities changes as the boundary lines move. ② Core mathematical concepts include linear inequalities, half-planes, feasible regions, line equations (y = mx + b), and the geometric representation of inequality solution sets. ③ Construction highlights: from the summary, sliders (m1, yint1, m2, yint2) control line parameters; polygons (a, b, c, etc.) represent shaded regions; text objects (text1–text6) display inequality expressions or labels; additional elements like translation and incircle may be used for auxiliary visualization. ④ Suitable for middle and high school mathematics, this interactive tool helps students grasp the graphical method for solving systems of linear inequalities, explore how parameter changes affect the solution region, and serves as a bridge between algebra and geometry.
GeoGebra Commands & Parameters
Numeric m1(1.0)Numeric yint1(1.0)a(x, y) = y < (m1 * x) + yint1a_1(x, y) = y ≤ (m1 * x) + yint1a_2(x, y) = y > (m1 * x) + yint1a_3(x, y) = y ≥ (m1 * x) + yint1Boolean b(false)Boolean c(false)Boolean d(false)Boolean e(false)Numeric m2(-1.0)Numeric yint2(1.0)f(x, y) = y < (m2 * x) + yint2f_1(x, y) = y ≤ (m2 * x) + yint2f_2(x, y) = y > (m2 * x) + yint2f_3(x, y) = y ≥ (m2 * x) + yint2Boolean h(false)Boolean i(false)Boolean j(false)Boolean g(false)
AI Drawing Prompt Reference
Create a dynamic mathematics figure featuring two adjustable straight lines. The first line has a slope controlled by a slider around 1 and a y-intercept around 1; the second line has a slope around -1 and a y-intercept around 1. Each line corresponds to four optional inequality relationships: y less than, y less than or equal to, y greater than, and y greater than or equal to the line equation. Toggle switches can select which inequalities to display, showing intuitively how solution sets of linear inequalities (half-planes) change as boundary lines move, helping understand the geometric meaning of feasible regions.
The prompt above was compiled from the original drawing commands and is for reference only.