
Systems of Linear Equations by George Cadiente (3)
Loading the math board and drawing, please wait…
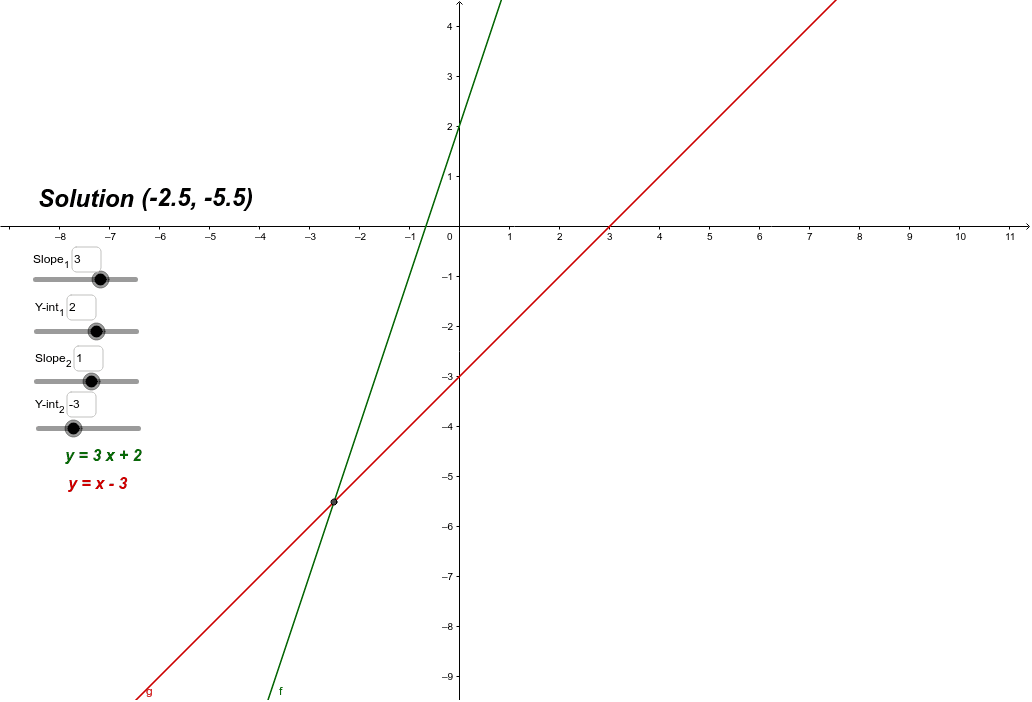
This example demonstrates how to plot and analyze the intersection points of two linear equations using GeoGebra. Core math concepts include linear equations, coordinate geometry, inequalities, and function graphing. Key GeoGebra commands and objects used are Intersect, Textfield, sliders (m, b, m2, b2), functions (f, g), intersection point (A), input boxes (InputBox1-4), and text objects (text1-3, Line_1). Suitable for high school mathematics education to understand solutions of linear systems and graphical transformations.
GeoGebra Commands & Parameters
Intersect(f, g, 1) → ATextfield(m) → InputBox1Textfield(b) → InputBox2Textfield(m2) → InputBox3Textfield(b2) → InputBox4
AI Drawing Prompt Reference
Draw two lines with adjustable slopes and intercepts using sliders, and mark their intersection point. Include input boxes for users to enter the slopes and intercepts, displaying these values as text. Finally, represent the region enclosed by the lines using inequalities.
The prompt above was compiled from the original drawing commands and is for reference only.