
Linear Inequalities Slider Demo
Loading the math board and drawing, please wait…
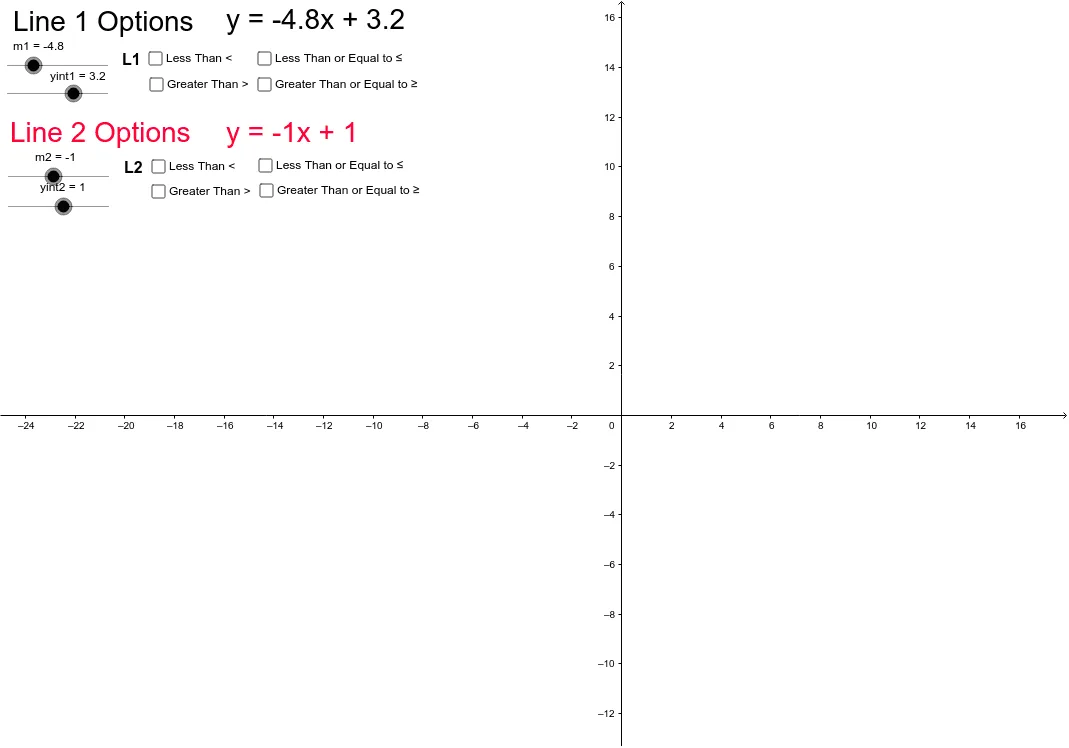
This example dynamically demonstrates the solution set of linear inequalities on a coordinate plane using sliders. It covers core math concepts like linear inequalities, solution sets, number line representations, and region partitioning. GeoGebra commands and objects such as m1, yint1, a, a_1, a_2, a_3, b, c, d, e, text1, text2, m2, yint2, f, f_1, f_2, f_3, h, i, j, g, text3, text4, text5, text6 are used to draw lines, label inequality solutions, and adjust parameters dynamically. Suitable for high school students learning the geometric meaning of linear inequalities and classroom demonstrations.
GeoGebra Commands & Parameters
Numeric m1(-4.8)Numeric yint1(3.2)a(x, y) = y < (m1 * x) + yint1a_1(x, y) = y ≤ (m1 * x) + yint1a_2(x, y) = y > (m1 * x) + yint1a_3(x, y) = y ≥ (m1 * x) + yint1Boolean b(false)Boolean c(false)Boolean d(false)Boolean e(false)Numeric m2(-1.0)Numeric yint2(1.0)f(x, y) = y < (m2 * x) + yint2f_1(x, y) = y ≤ (m2 * x) + yint2f_2(x, y) = y > (m2 * x) + yint2f_3(x, y) = y ≥ (m2 * x) + yint2Boolean h(false)Boolean i(false)Boolean j(false)Boolean g(false)