
Line and Parabola Intersection
Loading the math board and drawing, please wait…
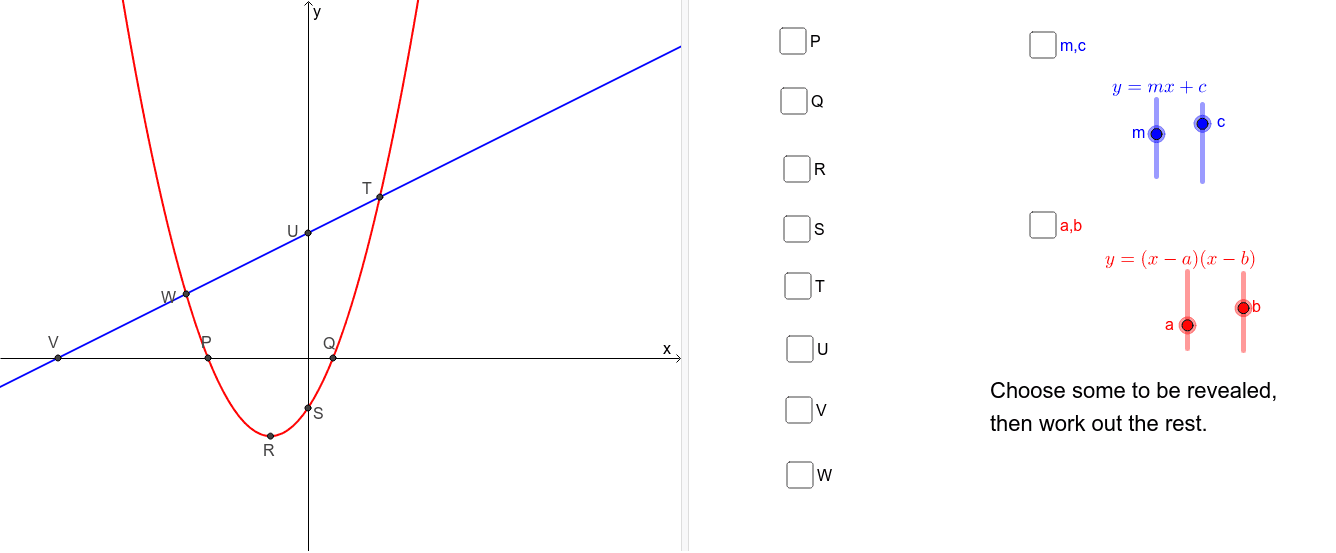
This example demonstrates the intersection of a line and a parabola, allowing dynamic adjustment of the line's parameters to observe how the number and positions of intersection points change. Core math concepts include quadratic functions, linear functions, solving systems of equations (intersection points), and the discriminant. Construction highlights: uses GeoGebra's Intersect command to find intersection points, SurdText to display exact radical-form coordinates; objects include line a, parabola f, intersection points T, W, and multiple text labels for numerical display. Suitable for middle and high school mathematics, particularly for learning function graphs and equation solving, and useful for classroom demonstrations or student exploration.
GeoGebra Commands & Parameters
Intersect(f, d, 2) → TIntersect(f, d, 1) → WIntersect(f, xAxis, 1) → PIntersect(d, xAxis) → VIntersect(d, yAxis) → UIntersect(f, yAxis, 1) → SIntersect(f, xAxis, 2) → QSurdText(P) → text3SurdText(Q) → text4SurdText(R) → text5SurdText(S) → text6SurdText(T) → text7SurdText(U) → text8SurdText(V) → text9SurdText(W) → text10
AI Drawing Prompt Reference
Draw the intersection points of a parabola and a line, allowing dynamic adjustment of the line's parameters to observe changes in the number and positions of intersection points. Show the points where the parabola and line intersect the x-axis and y-axis. Display exact radical-form coordinates for all intersection points using text labels.
The prompt above was compiled from the original drawing commands and is for reference only.