
Least Squares Line Demonstration
Loading the math board and drawing, please wait…
In collections
Statistical Intuition Builders
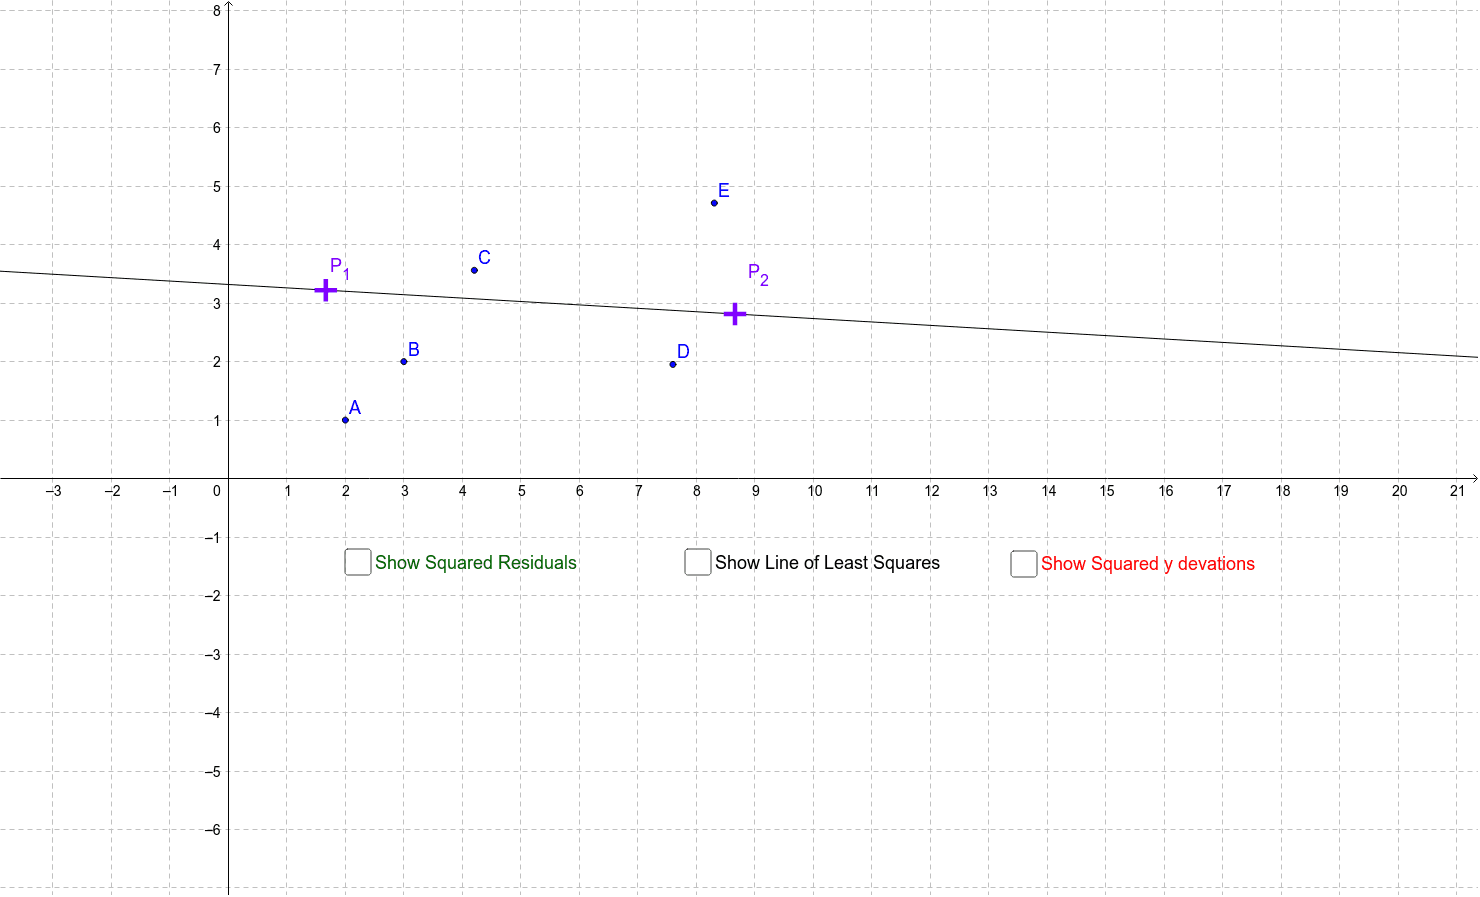
This example illustrates how to fit a line to data points using the Least Squares method, demonstrating key concepts like regression analysis, residuals, and variance minimization. It employs GeoGebra commands such as Line, Sequence, Textfield, MeanY, Sum, FitLineY, Polygon, Intersect, ResidualPlot, Point, and Segment for interactive visualization. Ideal for high school students and beginners in statistics learning data fitting techniques.
GeoGebra Commands & Parameters
Line(P_1, P_2) → aSequence(OrthogonalLine[Element[list1, n], xAxis], n, 1, Length[list1]) → verticalsSequence(Intersect[Element[verticals, n], a], n, 1, Length[verticals]) → projectOnLineTextfield(list1) → setSequence(Segment[Element[list1, n], Element[projectOnLine, n]], n, 1, Length[list1]) → residualsSequence(Polygon[Element[list1, n], Element[projectOnLine, n], 4], n, 1, Length[list1]) → residsquareMeanY(list1) → bSequence(Intersect[Element[verticals, n], ybar], n, 1, Length[verticals]) → projectOnybarSequence(Polygon[Element[list1, n], Element[projectOnybar, n], 4], n, 1, Length[list1]) → ydevsquareSum(ydevsquare) → SSybarSum(residsquare) → SSresFitLineY(list1) → fPolygon(F, G, 4) → poly1, h, i, j, k, H, IPolygon(F, J, 4) → poly2, m, n, q, r, K, LIntersect(n, q) → MIntersect(q, r) → NIntersect(j, k) → OIntersect(i, j) → PIntersect(h, i) → QPolygon(N, O, P, Q, J, M) → poly3, n_1, o, p, q_1, j_1, m_1ResidualPlot(list1, f) → leastSqResidSum(y(leastSqResid)^(2)) → leastSqSSresPoint(Circle[R, 3]) → SSegment(R, S) → eIntersect(Circle[R, If[Rsquared > 0, abs((Rsquared * e)), 0]], e) → TopScore,Segment(R, TopScore) → s
AI Drawing Prompt Reference
Draw a set of data points and a fitted line to illustrate the least squares fitting process. First, plot the data points and the fitting line. Then, draw perpendicular segments from each data point to the line, called residuals. Construct polygons using these residuals and corresponding points, and calculate their areas. Also, draw a mean line for the data points and perpendicular segments to this line, forming another set of polygons with calculated areas. Finally, create a polygon using the residuals and mean line. The entire illustration demonstrates how the least squares method minimizes the sum of squared residuals to fit the line.
The prompt above was compiled from the original drawing commands and is for reference only.