
General Function Graphing and Interaction
Loading the math board and drawing, please wait…
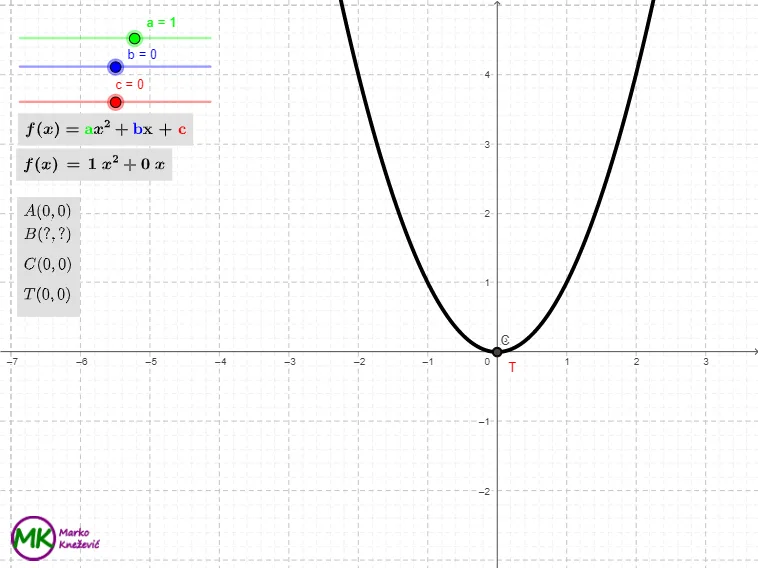
This example demonstrates how to graph and interact with general functions, including polygons, vectors, extrema, and parametric equations. Key math concepts involve function graphing, vector operations, extrema solving, parametric equations, and analytical geometry. Construction highlights from the summary include commands like Extremum (for extrema), Intersect (for intersections), Vector (for vectors), and LaTeX (for formulas). Suitable for high school students and teachers for function graphing, geometric transformations, and calculus instruction.
GeoGebra Commands & Parameters
Extremum(f) → TIntersect(xAxis, yAxis) → A_{1}Intersect(xAxis, yAxis) → DVector(D, B_{4}) → uVector(B_{4}, T) → vLaTeX(f, true, true) → text1Intersect(f, xAxis) → A, BIntersect(f, yAxis) → C
AI Drawing Prompt Reference
In the same coordinate plane, draw the two coordinate axes and plot a general function curve f. Mark where the curve f intersects the x-axis and y-axis, and identify an extremum point on the curve. Using points determined by those axis intersection locations, draw two vectors so that the first vector goes from one intersection point toward another, and the second vector starts at that second point and points toward the extremum point, showing a consecutive relationship. Add a formatted text label for the formula of f and display the remaining intersection points with the axes.
The prompt above was compiled from the original drawing commands and is for reference only.