
Graph with Zeros
Loading the math board and drawing, please wait…
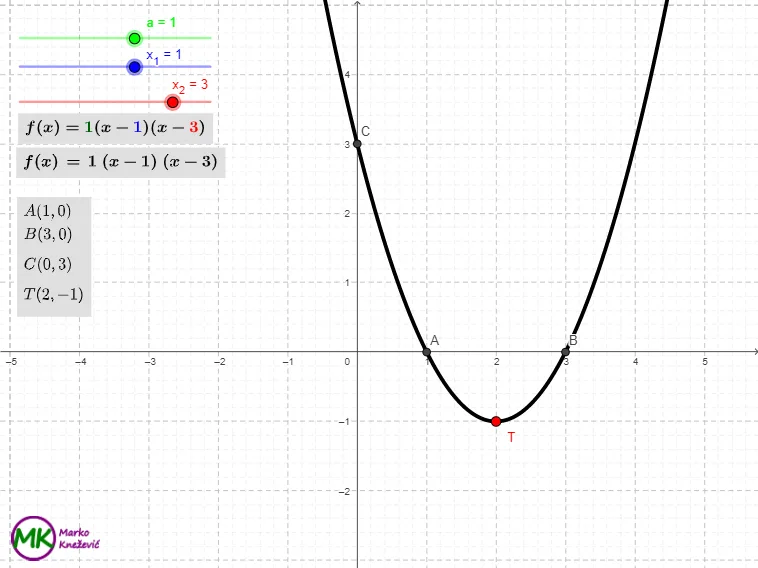
This example demonstrates a graph with zeros. It involves core concepts of function graphs, calculus, and coordinate geometry. Using GeoGebra commands such as Extremum, Intersect, and Vector, a graph with zeros can be constructed. Suitable for high school mathematics education and learning.
GeoGebra Commands & Parameters
Extremum(f) → TIntersect(xAxis, yAxis) → A_{1}Intersect(xAxis, yAxis) → DVector(D, B_{4}) → uVector(B_{4}, T) → vLaTeX(f, true, true) → text1Intersect(f, xAxis) → A, BIntersect(f, yAxis) → C
AI Drawing Prompt Reference
Draw a graph of a function with its zeros clearly marked. Start by plotting the curve, then locate and label its extremum point. Mark the two intersections with the x-axis and one with the y-axis. Also indicate the origin where the axes meetcars. From the origin, draw two vector arrows: one pointing to the extremum, and another to one of the x-axis intercepts. Finally, display the function's formula as text near the graph. The overall image shows a function with labeled zeros, extremum, and directional vectors.
The prompt above was compiled from the original drawing commands and is for reference only.