
Function Graph and Differential Geometry Demo
Loading the math board and drawing, please wait…
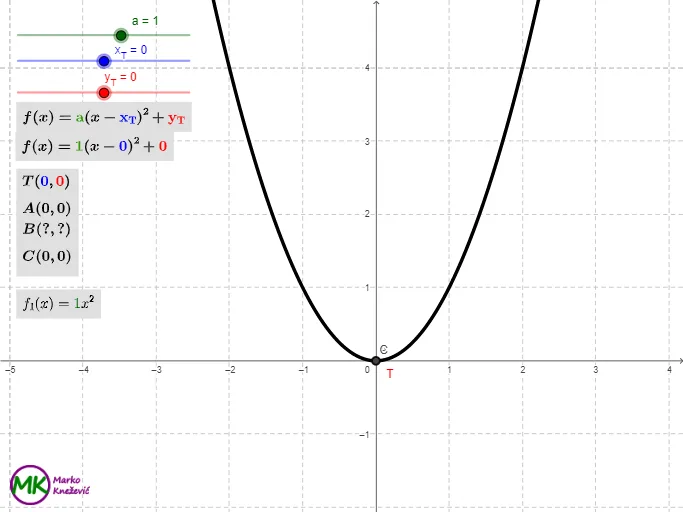
This example demonstrates the geometric meaning of function graphs and differential calculations, involving core math concepts like function graphs, differential calculus, geometric mean, standard deviation, real numbers, and cube roots. It utilizes GeoGebra commands and objects such as Extremum (finding extrema), Intersect (finding intersections), Vector (vectors), and If (conditional statements) as highlighted in the construction summary. Suitable for high school and above students to understand function properties and calculus applications.
GeoGebra Commands & Parameters
Extremum(f) → TIntersect(xAxis, yAxis) → A_{1}Intersect(xAxis, yAxis) → DVector(D, B_{5}) → uVector(B_{5}, T) → vIf(x_T < 0, true, false) → negativeX_0If(y_T < 0, true, false) → negativeY_0Intersect(f, xAxis) → A, BIntersect(f, yAxis) → C
AI Drawing Prompt Reference
Draw a function graph and illustrate its differential geometry meaning. First, plot the function curve and mark its extremum point. Then draw the coordinate axes and label the origin. From the origin, draw a vector along the x-axis direction, and from the endpoint of that vector, draw another vector to the extremum point. Finally, use conditional logic to indicate whether the extremum's x and y coordinates are negative, and mark all intersection points of the function with the axes. The overall figure should clearly show the function, extremum, vectors, and intersections.
The prompt above was compiled from the original drawing commands and is for reference only.