
Critical Points of f(x,y): Local Max/Min/Saddle
Loading the math board and drawing, please wait…
In collections
₁ΛM 0 -Critical points and their nature using hessian matrix
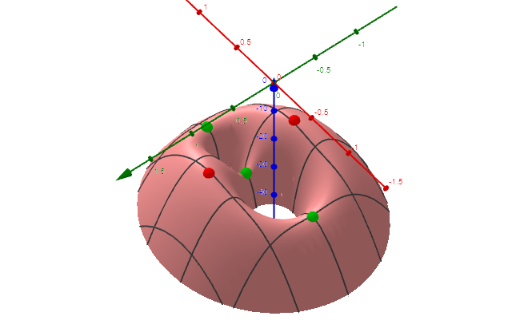
This example demonstrates the visualization of critical points (local maxima, minima, and saddle points) of a function f(x,y) in 3D space. Key math concepts include multivariable functions, partial derivatives, Hessian matrix, and second derivative test. GeoGebra commands like ImplicitCurve, Zip, Sequence, TableText, LaTeX, Sort, Length, Max, RotateText are used for plotting implicit curves, handling sequences, displaying text/formulas, sorting, and rotating elements. Suitable for university-level calculus, multivariable function analysis, and teaching demonstrations.
GeoGebra Commands & Parameters
ImplicitCurve(fx(x, y)) → axImplicitCurve(fy(x, y)) → ayZip({{fxx(a), fxy(a)}, {fyx(a), fyy(a)}}, a, l1) → MZip(Determinant[a], a, M) → DZip(fxx(a), a, l1) → f_{xx}Sequence(If[D(i) > 0, If[f_{xx}(i) > 0, "local minimum", "local maximum"], If[(D(i) * f_{xx}(i)) ≟ 0, "?", "saddle point"]], i, 1, Length[l1]) → l4, {"saddle point", "local maximum", "local maximum", "saddle point", "saddle point"}Zip((x(a), y(a), f(a)), a, l1) → l5Zip(fx(a), a, l1) → lfxZip(fy(a), a, l1) → lfyTableText(Append["i", 1…Length[l1]], Append["critical points", l5], Append["f_{x}", lfx], Append["f_{y}", lfy], Append["f_{xx}", f_{xx}], Append["Det", D], Append["", l4], "v") → text1LaTeX(f, true) → text2Sequence(If[D(i) > 0, If[f_{xx}(i) > 0, 1, 2], If[D(i) ≟ 0, -5, -1]], i, 1, Length[l1]) → l4a, {-1, 2, 2, -1, -1}Sort(l5, l4a) → l5aSort(l1, l4a) → l1aLength(lmax) → lämaxLength(lmin) → läminLength(lsad) → läsadSort(l4, l4a) → l4aaTableText(Append["i", 1…Length[l1]], Append["critical points", l5a], Append["", l4aa], "v") → text1aLength(lq) → läqImplicitCurve(f(x, y) - z0) → IFxyZip((x(a), y(a)), a, lsad) → lsad_2Zip((x(a), y(a)), a, lq) → lq_2Zip((x(a), y(a)), a, lmax) → lmax_2Zip((x(a), y(a)), a, lmin) → lmin_2Max(z(lmax)) → maxMax(z(lmin)) → minRotateText(txt1, 90°) → txt2
AI Drawing Prompt Reference
Plot the function f(x,y) in 3D space, first draw the contour lines of f(x,y), then find the first and second partial derivatives, use the signs of the second partial derivatives to determine the nature of each critical point, and finally mark these critical points with their properties.
The prompt above was compiled from the original drawing commands and is for reference only.