
Investigating Systems of Inequalities: Visualizing Feasible Regions
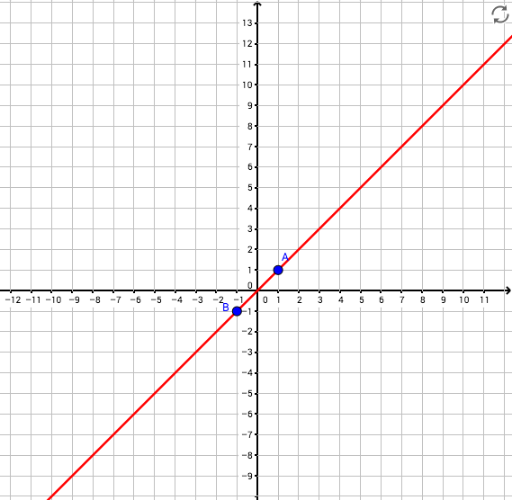
Loading the math board and drawing, please wait…
This GeoGebra example demonstrates how to explore systems of inequalities by visualizing their solution regions on a coordinate plane. It combines multiple linear and nonlinear constraints, such as linear equations, exponential functions, and possibly Pythagorean-related conditions, to show the intersection area that satisfies all inequalities. The core mathematical concepts include systems of inequalities, linear equations, exponential functions, and the geometric interpretation of feasible regions. The construction uses commands like Random and RandomPolynomial to generate random coefficients, Element to extract list items, Line to draw boundary lines, and If for conditional logic to distinguish feasible from infeasible areas. Objects include points (A, B, C, etc.), segments (a, b, c, etc.), lists (list1, list2, list3), text elements (text2 to text13), and a button (button1), suggesting interactive controls to refresh random conditions or toggle displays. This resource is suitable for high school students learning about inequalities, introductory linear programming, or the connection between algebra and geometry, as well as for pre-university mathematics demonstrations.
GeoGebra Commands & Parameters
Random(1, 4) → aRandom(1, 4) → bRandomPolynomial(1, -10, 10) → pRandomPolynomial(1, -10, 10) → hElement(list1, a) → cElement(list2, b) → eLine(F, G) → lLine(F, G) → mIf(i ≟ 0 ∧ (a < 3) ∨ i ≟ 1 ∧ (a > 2), 1, 0) → nIf(n ≟ 1 ∧ l ≟ h, 1, 0) → oLine(H, I) → qLine(I, H) → rIf(j ≟ 0 ∧ (b < 3) ∨ j ≟ 1 ∧ (b > 2), 1, 0) → sIf(s ≟ 1 ∧ q ≟ p, 1, 0) → u
AI Drawing Prompt Reference
Draw a coordinate plane showing a feasible region defined by a system of inequalities. Include two random straight lines as linear boundaries and two random curves (e.g., parabolas) as nonlinear constraints. Use distinct colors to highlight the area satisfying all conditions versus the infeasible areas. Mark intersection points of the boundaries. Add a button that, when clicked, regenerates random boundary conditions and updates the feasible region. Display text labels indicating the inequality signs (greater/less) for each constraint and the logic for determining feasibility. The overall graph should clearly illustrate the intersection of linear and nonlinear inequalities for educational demonstration.
The prompt above was compiled from the original drawing commands and is for reference only.