
Dot Plots and Box Plots
Loading the math board and drawing, please wait…
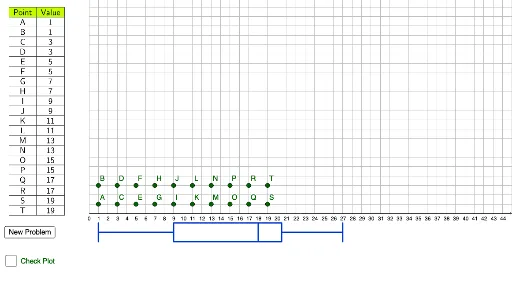
This example demonstrates how to manipulate a dot plot to match another dot plot. It involves core mathematical concepts such as box plots, statistics, frequency distribution, congruence, expected value, and conditional probability. The construction utilizes GeoGebra commands/objects like Random (random number generation), BoxPlot (box plot), Median (median), Q1 (first quartile), Q3 (third quartile), Max (maximum value), Min (minimum value), and TableText (table text). Suitable for high school students learning statistics and data analysis.
GeoGebra Commands & Parameters
Random(1, 30) → E2Random(1, 30) → E3Random(1, 30) → E4Random(1, 30) → E5Random(1, 30) → E6Random(1, 30) → E7Random(1, 30) → E8Random(1, 30) → E9Random(1, 30) → E10Random(1, 30) → E11Random(1, 30) → E12Random(1, 30) → E13Random(1, 30) → E14Random(1, 30) → E15Random(1, 30) → E16Random(1, 30) → E17Random(1, 30) → E18Random(1, 30) → E19Random(1, 30) → E20Random(1, 30) → E21BoxPlot(-5, 1, B2:B21) → bMedian(B2:B21) → C25Median(E2:E21) → C24Q1(E2:E21) → B24Q1(B2:B21) → B25Q3(E2:E21) → D24Q3(B2:B21) → D25Max(E2:E21) → E24Max(B2:B21) → E25Min(E2:E21) → A24Min(B2:B21) → A25TableText({{A1, B1}, {A2, B2}, {A3, B3}, {A4, B4}, {A5, B5}, {A6, B6}, {A7, B7}, {A8, B8}, {A9, B9}, {A10, B10}, {A11, B11}, {A12, B12}, {A13, B13}, {A14, B14}, {A15, B15}, {A16, B16}, {A17, B17}, {A18, B18}, {A19, B19}, {A20, B20}, {A21, B21}}, "|_cc") → text1TableText({{A23, B23, C23, D23, E23}, {A24, B24, C24, D24, E24}, {A25, B25, C25, D25, E25}}, "|_ccccc") → text2BoxPlot(-2, 1, E2:E21) → a