
Inverse Relations: Graphs
Loading the math board and drawing, please wait…
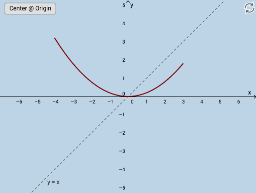
① This interactive GeoGebra example dynamically demonstrates the graphical relationship between a function and its inverse, especially their symmetry about the line y = x. ② Core mathematical concepts include the definition of inverse functions, symmetry of graphs, swapping of domain and range, and real-time adjustment of function expressions to observe changes. ③ Construction highlights: uses the Mirror command to reflect the function graph across y = x, employs Textfield and InputBox for editable inputs, a button (button2) to trigger updates, and involves objects such as f, g, f_1, a, b, h, h_1, c, d, f_2, e, where a, b, c, d may serve as parameters or coordinates, creating a fully interactive investigation environment. ④ Suitable for high school or early college students learning functions and inverse functions, as well as for classroom demonstrations or self-study to grasp the geometric essence of inverse relations.
GeoGebra Commands & Parameters
Mirror(f, g) → f_1Textfield(f) → InputBox1Mirror(h, g) → h_1Textfield(a) → InputBox2Textfield(b) → InputBox3Mirror(f, g) → f_2