
Interactive Graphing of Logarithmic Functions and Transformations
Loading the math board and drawing, please wait…
In collections
Graphing Logarithmic Functions
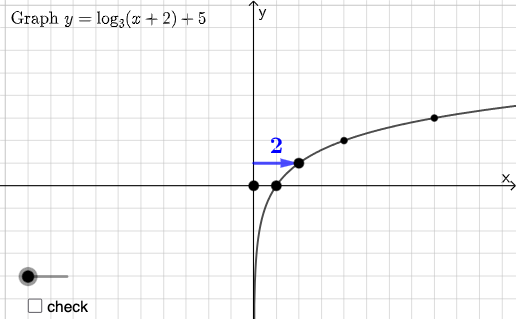
This example uses an interactive “You Try It” setup to demonstrate how logarithmic function graphs change under parameter changes and standard transformations. It highlights key behaviors such as domain restrictions, the characteristic shape of y = log_b(x), the role of the vertical asymptote, and how shifts, scalings, and reflections affect intercepts and the growth/decay direction. The main concepts are logarithmic functions, function graphing, and transformation of graphs for clear geometric interpretation. Construction is based on GeoGebra commands and workflow: Point and Random to generate key points and parameter instances, Intersect to compute intersection points for determining transformed coordinates, Vector to represent direction or auxiliary structures, If to handle conditional (piecewise) construction logic, and RandomElement to select among candidate parameters/elements. The model includes multiple objects (e.g., function entities like g, h, k and supporting labels/text such as eq1 and text1–text10) to display equations and guide interpretation. Suitable for high school advanced algebra through early college-level function and transformation instruction, including classroom demonstrations and exploratory learning with a focus on graph reading and construction.
GeoGebra Commands & Parameters
Point(Ray[B + (1, 1), B + (2, 1)]) → CPoint(Ray[B + (1, -1), B + (2, -1)]) → DIntersect(xAxis, yAxis) → GVector(G, A) → uVector(H, B) → vIntersect(eq1, y = y(C)) → IIntersect(eq1, y = y(D)) → JVector(I, C) → wVector(J, D) → jRandom(-5, 5) → lRandom(-5, 5) → mRandomElement({2, 3, 4, 5, 6}) → bbRandom(-5, 5) → nRandom(0, 1) → ggIf(gg ≟ 0, log(bb, x - m) + 5, (-log(bb, x - m)) + 5) → qIf(gg ≟ 0, f ≟ q, p ≟ q) → o
AI Drawing Prompt Reference
Draw a graph of logarithmic functions and their transformations, showing domain restrictions, characteristic shape, and vertical asymptotes. Include function entities and labels/text, demonstrating how shifts, scalings, and reflections affect intercepts and growth/decay directions. Suitable for function graphing and transformation teaching.
The prompt above was compiled from the original drawing commands and is for reference only.