
Geometric Visualization of Adding and Subtracting Fractions (Non‑Mixed)
Loading the math board and drawing, please wait…
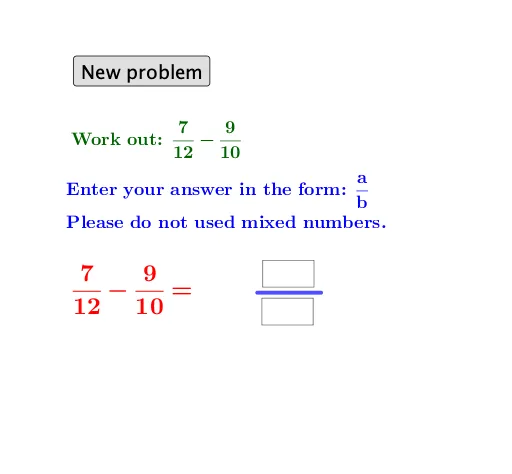
This example demonstrates how to add and subtract non‑mixed fractions using geometry-based representations. It makes the numerical result intuitive by visually encoding fractional parts and their changes under operations. The key math concepts include fractions (numerator/denominator), fraction units, and the interpretation of addition/subtraction as combining or removing equal parts, supported by intersection/overlap-style reasoning. Construction-wise, the build uses GeoGebra commands and interactive elements reflected in the construct summary: Random and RandomElement to generate fraction parameters, If to switch between addition and subtraction cases, Textfield and InputBox1/InputBox2 for user input and dynamic display, Numerator and Denominator to extract parts of the fraction, Segment to create the geometric partitioning, and FractionText to render readable fraction labels. Objects such as button1, multiple text labels (text1–text9), and additional stored points/segments support the visualization and UI workflow. Suitable for middle and high school math instruction and for classroom demonstrations or exploratory learning.
GeoGebra Commands & Parameters
Random(1, 10) → bRandom(b + 1, 12) → cRandom(1, 10) → eRandom(e + 1, 12) → fRandomElement(l1) → dRandom(1, 10) → aIf(d < 0, ((-((f * abs(d)) + e))) / f, ((f * d) + e) / f) → rRandom(1, 10) → gRandom(1, 10) → hRandom(h + 1, 12) → iTextfield(k) → InputBox1If(d < 0, s - t, s + t) → jNumerator(j) → lDenominator(j) → mSegment(A, B) → pTextfield(o) → InputBox2If(l ≟ k ∧ m ≟ o, "Correct!", "Wrong. Try again.") → text2FractionText(s) → text8FractionText(t) → text9
AI Drawing Prompt Reference
Visualize the addition and subtraction of fractions using geometric representations. Generate two random fractions, represent each fraction with colored line segments for numerators and denominators, and calculate their sum or difference. Display the original fractions, the result, and verify user input with text labels. Start by drawing line segments for the fractions, then compute the result based on the chosen operation, differentiate with colors, and finally show all information with text labels.
The prompt above was compiled from the original drawing commands and is for reference only.