
Inverse Function Graphing and Verification
Loading the math board and drawing, please wait…
In collections
Fun with Functions
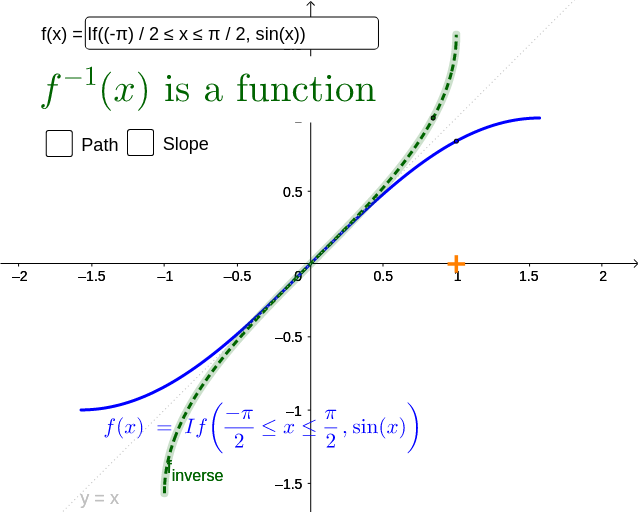
This example demonstrates how to graph an inverse function by reflecting the original function about the line y=x and tests if the new curve is a function. It illustrates the One-to-One requirement for inverse functions. The construction uses GeoGebra commands like Sequence, Mirror, Zip, Max, Textfield, Point, Vector, Tangent, and ParametricDerivative. Suitable for high school mathematics education to help students understand the properties and determination criteria of inverse functions.
GeoGebra Commands & Parameters
Sequence(x = j, j, c1, c3, (c3 - c1) / 20) → vlinesMirror(f, g) → f_{inverse}Zip({Intersect[vl, f_{inverse}]}, vl, vlines) → isectsZip(Length[in], in, isects) → list2Max(list2) → aTextfield(f) → InputBox1Point(xAxis) → AVector(A, B) → uVector(B, C) → vVector(C, D) → wVector(D, E) → bVector(E, F) → cVector(F, A) → dTangent(B, f) → hParametricDerivative(f_{inverse}) → pder