
Graphs of Logarithmic Functions
Loading the math board and drawing, please wait…
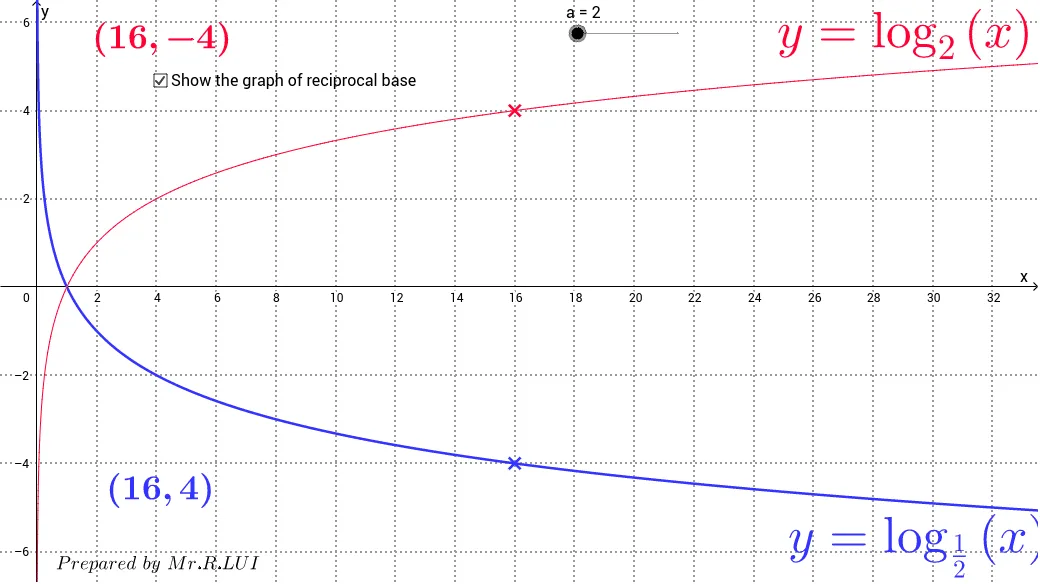
This example shows the graphs of logarithmic functions with bases a and 1/a (a=2,3,4,5) on the same coordinate plane. Key mathematical concepts include logarithmic functions and their properties. Using GeoGebra commands such as Point and Mirror, the example demonstrates the characteristics of logarithmic function graphs. Suitable for high school mathematics education and learning.
GeoGebra Commands & Parameters
Point(g) → PMirror(P, xAxis) → Q
AI Drawing Prompt Reference
Draw on one coordinate plane the graphs of logarithmic functions with bases 2, 3, 4, and 5, and also their reciprocal-base counterparts (1/2, 1/3, 1/4, 1/5). Start by plotting one logarithmic curve, place a point on it, then reflect that point across the x-axis to show the mirror relationship between each pair of curves. Ensure all curves are clearly labeled, with visible axes and grid, to illustrate how the graphs change with base and their symmetry about the x-axis.
The prompt above was compiled from the original drawing commands and is for reference only.