
Comparing Logarithm and Exponential Function Graphs
Loading the math board and drawing, please wait…
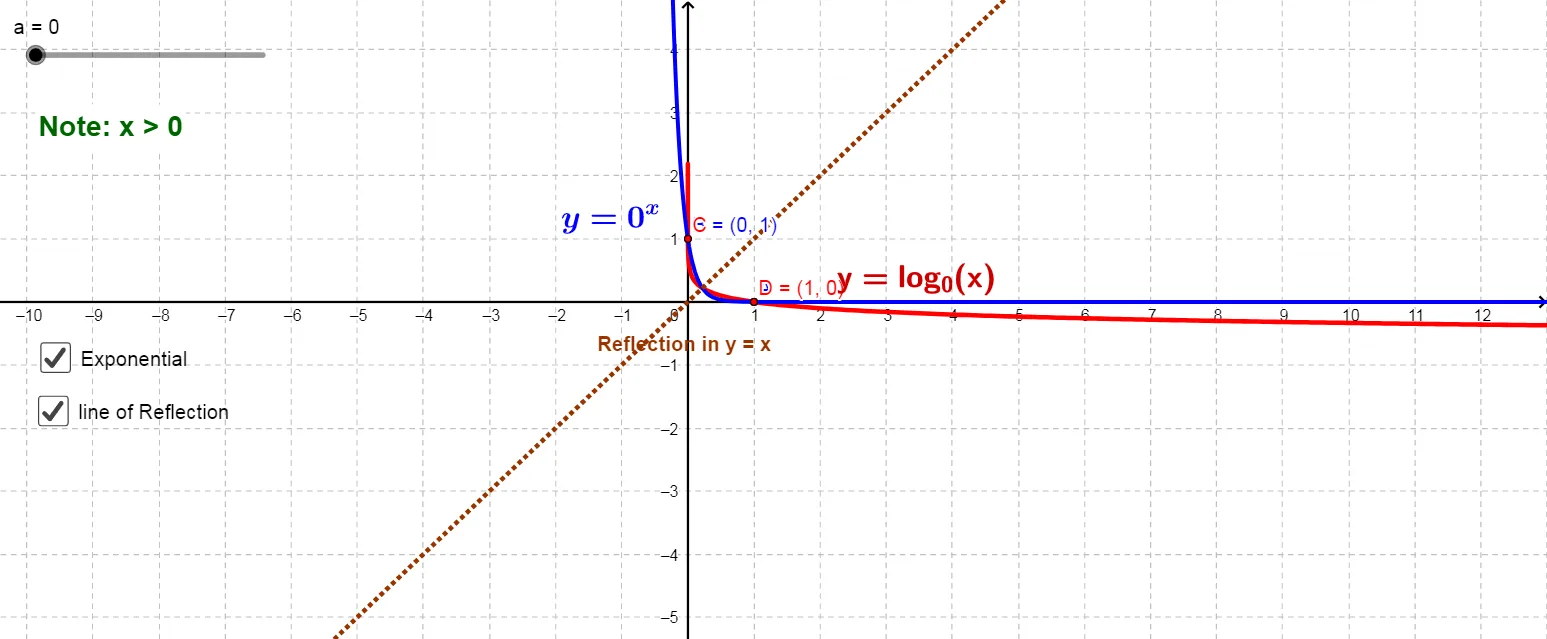
This example demonstrates the graphs of logarithmic and exponential functions, highlighting their shapes, properties, and the relationship between them as inverse functions. Key mathematical concepts include function analysis, monotonicity, and the characteristics of logarithmic and exponential curves. The GeoGebra construction utilizes objects like sliders (a, b), functions (f, g), text elements (text1-text4), and points (c, d, A-B) to visualize and compare these functions dynamically. It is suitable for high school mathematics education, focusing on function behavior and comparative analysis.
GeoGebra Commands & Parameters
Numeric a(0.001)f(x) = lg(x) / lg(a)g(x) = a^(x)Line b(-1, 1, 0)Boolean c(true)Boolean d(true)Point A(1, 0)(a, 1)Point C(0, 1)(1, a)
AI Drawing Prompt Reference
Draw the graphs of logarithmic function f(x) = log_a(x) and exponential function g(x) = a^x, where a is adjusted by a slider. Include a line b(-1,1,0) and points A(1,0) and C(0,1) to help observe the functions' monotonicity and inverse relationship.
The prompt above was compiled from the original drawing commands and is for reference only.