
Introduction to Polar Coordinates by Gareth Daniels
Loading the math board and drawing, please wait…
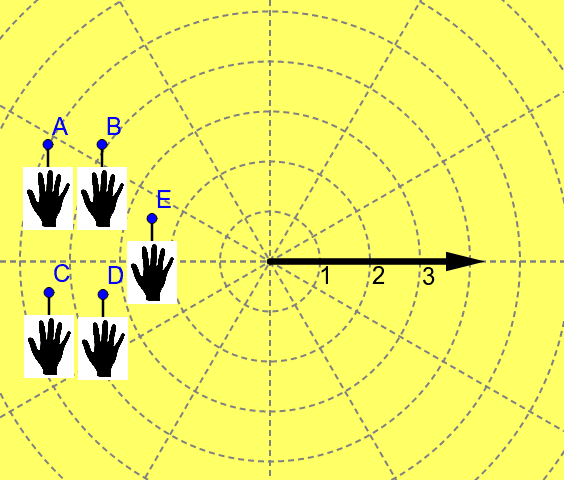
This example quickly demonstrates how points are represented in the polar coordinate system. Key mathematical concepts include polar coordinates and point position representation. It uses Segment, Distance, If, Vector, and other GeoGebra commands for construction. Suitable for middle school and above students to learn the basics of the polar coordinate system.
GeoGebra Commands & Parameters
Segment(A, A_1) → aSegment(B, B_1) → bSegment(C, C_1) → cSegment(D, D_1) → dSegment(E, E_1) → eDistance(A, K) → disAIf(disA > 1, 1, disA) → colAVector(L, M) → uDistance(B, N) → disBIf(disB > 1, 1, disB) → colBDistance(C, O) → disCIf(disC > 1, 1, disC) → colCDistance(D, P) → disDDistance(E, Q) → disEIf(disD > 1, 1, disD) → colDIf(disE > 1, 1, disE) → colE
AI Drawing Prompt Reference
Draw a polar coordinate system illustration to show how points are represented in polar coordinates. Start by plotting five points A, B, C, D, and E, and draw line segments from each point to its corresponding polar position. Then measure the distance from each point to the origin; if the distance is greater than 1, set the color to 1, otherwise keep the original color. Finally, draw a vector from point L to point M.
The prompt above was compiled from the original drawing commands and is for reference only.