
Latitude–Longitude Distance: A Geometric Globe Visualization
Loading the math board and drawing, please wait…
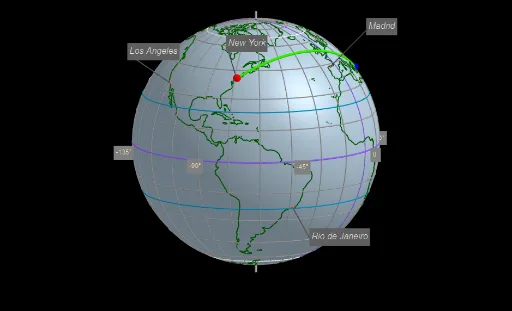
This example demonstrates how distances between locations defined by latitude and longitude can be visualized using geometric construction on a spherical (globe-like) model. It emphasizes spatial relationships by showing parallels and meridians and relating angular information to measurable distance cues. The key math concepts include geographic coordinates (latitude/longitude), vector representation, length measurements, angles, and circular arcs; it also leverages sphere/circle geometry to make the metric intuition clear. Construction highlights include: Length for distance computations; Element/Segment/Sequence to build and connect defining points and parameter chains; Sphere to create the globe surface reference; Point and Vector to represent locations and directions; Circle and CircleArc to draw relevant great-/small-circle traces; Angle to encode bearings or included angles; Textfield to display parameters/values; KeepIf to filter points satisfying constraints; and additional objects (e.g., parallels/meridians/equator/Greenwich display toggles and predefined angular constructions) to structure the interactive visualization. Suitable for upper secondary through introductory university levels, especially for geometry construction, vector reasoning, and coordinate-geometry intuition in real-world contexts.
GeoGebra Commands & Parameters
Length(capitalesLista) → capitalesNumElement(tiempo, 7) → añoSegment(PS + (0.075 * PS), PN + (0.075 * PN)) → ejeLength(ciudadesLista) → ciudadesNumSequence(If[Element[ciudadesLista, k] > 0, k, 0], k, 1, ciudadesNum) → ciudadesElegidas1, {1, 0, 3, 0, 0, 0, 0, 0, 9, 0, 0, 0, 13, 0, 0, 0}KeepIf(x > 0, ciudadesElegidas1) → ciudadesElegidas2Length(ciudadesElegidas2) → ciudadesNumElegidasSequence((5; Element[ciudadesLongitud, Element[ciudadesElegidas2, k]]°; Element[ciudadesLatitud, Element[ciudadesElegidas2, k]]°), k, 1, ciudadesNumElegidas) → ciudades, {(5; 316.77*°; -22.9*°), (5; 353.88691*°; 43.48818*°), (4.999999999999999; 241.75*°; 34.05*°), (5; 286*°; 40.72*°)}Sequence((1.5 * Element[ciudades, k]), k, 1, ciudadesNumElegidas) → baseCiudades, {(5.033887424956106, -4.732097411365642, -2.9184296260515468), (5.4104311124157975, -0.5794585197841322, 5.1615368836861695), (-2.94126498214301, -5.473960329575279, 4.199371216629386), (1.5668054176673767, -5.464099844261399, 4.892722521777698)}Sequence(Text[Element[ciudadesNombres, Element[ciudadesElegidas2, k]], Element[baseCiudades, k] + (0.03, 0.03, 0.03)], k, 1, ciudadesNumElegidas) → ciudadesNombresVisibles, {"Rio de Janeiro", "Madrid", "Los Angeles", "New York"}Sequence(Segment[(0, 0, 0), Element[baseCiudades, k]], k, 1, ciudadesNumElegidas) → laserOtros, {7.5, 7.5, 7.499999999999999, 7.5}Sphere((0, 0, 0), (0.999 * 5)) → tierraSegment(PN, PS) → eje2Point(eje2) → LVector((1; (-rot) + 180°; (-inclinacion))) → dirCircle((0, 0, 0), 5, eje) → ecuador2Circle((5; 0; (-anguloPolar)), (5; 90°; (-anguloPolar)), (5; 180°; (-anguloPolar))) → antarticoCircle((5; 0; anguloPolar), (5; 90°; anguloPolar), (5; 180°; anguloPolar)) → articoCircle((5; 0; anguloEcliptica), (5; 90°; anguloEcliptica), (5; 180°; anguloEcliptica)) → cancerCircle((5; 0; (-anguloEcliptica)), (5; 90°; (-anguloEcliptica)), (5; 180°; (-anguloEcliptica))) → capricornioCircle((0, 0, 0), 5, eje) → ecuadorCircle(PN, (5; 0; 0), PS) → greenwichSequence(Circle[PN, (5; (15° * k); 0), PS], k, 1, 11) → meridianos, {X = (-2.0825185391870887E-15, -4.4408920985006257E-16, 0) + (3.4150635094610964 cos(t) - 3.4150635094610973 sin(t), 0.9150635094610965 cos(t) - 0.9150635094610966 sin(t), -3.5355339059327373 cos(t) - 3.5355339059327378 sin(t)), X = (1.379275100632243E-16, 3.7493994566546446E-32, 0) + (3.0618621784789735 cos(t) - 3.061862178478973 sin(t), 1.7677669529663687 cos(t) - 1.7677669529663687 sin(t), -3.5355339059327378 cos(t) - 3.5355339059327378 sin(t)), X = (-3.061616997868383E-16, 4.440892098500626E-16, 0) + (2.500000000000001 cos(t) - 2.500000000000001 sin(t), 2.5 cos(t) - 2.4999999999999996 sin(t), -3.5355339059327378 cos(t) - 3.5355339059327378 sin(t)), X = (-8.4117094861807E-17, 4.440892098500626E-16, 0) + (1.7677669529663698 cos(t) - 1.7677669529663693 sin(t), 3.061862178478973 cos(t) - 3.061862178478972 sin(t), -3.5355339059327378 cos(t) - 3.5355339059327378 sin(t)), X = (-5.282063047118696E-16, -8.881784197001252E-16, 0) + (0.9150635094610976 cos(t) - 0.9150635094610977 sin(t), 3.4150635094610964 cos(t) - 3.4150635094610973 sin(t), -3.5355339059327386 cos(t) - 3.5355339059327378 sin(t)), X = (-3.0616169978683836E-16, 3.7493994566546446E-32, 0) + (0, 3.5355339059327378 cos(t) - 3.5355339059327378 sin(t), -3.5355339059327378 cos(t) - 3.5355339059327378 sin(t)), X = (-3.061616997868383E-16, 3.7493994566546446E-32, 0) + (-0.915063509461096 cos(t) + 0.915063509461096 sin(t), 3.4150635094610964 cos(t) - 3.4150635094610973 sin(t), -3.5355339059327373 cos(t) - 3.5355339059327378 sin(t)), X = (-3.061616997868383E-16, -4.4408920985006257E-16, 0) + (-1.7677669529663682 cos(t) + 1.7677669529663682 sin(t), 3.0618621784789735 cos(t) - 3.061862178478974 sin(t), -3.5355339059327378 cos(t) - 3.5355339059327378 sin(t)), X = (-8.4117094861807E-17, -2.2204460492503126E-16, 0) + (-2.4999999999999996 cos(t) + 2.5 sin(t), 2.5 cos(t) - 2.5000000000000004 sin(t), -3.5355339059327373 cos(t) - 3.5355339059327378 sin(t)), X = (-3.4147861687372766E-15, 1.7763568394002505E-15, 0) + (-3.0618621784789726 cos(t) + 3.0618621784789717 sin(t), 1.76776695296637 cos(t) - 1.7677669529663695 sin(t), -3.5355339059327373 cos(t) - 3.5355339059327378 sin(t)), X = (5.82016719913287E-16, -2.2204460492503126E-16, 0) + (-3.4150635094610964 cos(t) + 3.4150635094610973 sin(t), 0.9150635094610976 cos(t) - 0.9150635094610977 sin(t), -3.5355339059327386 cos(t) - 3.5355339059327378 sin(t))}Sequence(Circle[(5; 0; (15° * k)), (5; 90°; (15° * k)), (5; 180°; (15° * k))], k, 1, 5) → paralelosN, {X = (1.7763568394002505E-15, 0, 1.2940952255126037) + (-3.4150635094610955 cos(t) - 3.4150635094610955 sin(t), 3.4150635094610955 cos(t) - 3.4150635094610955 sin(t), 0), X = (8.881784197001252E-16, 4.440892098500626E-16, 2.4999999999999996) + (-3.0618621784789726 cos(t) - 3.0618621784789726 sin(t), 3.0618621784789726 cos(t) - 3.0618621784789726 sin(t), 0), X = (0, 0, 3.5355339059327373) + (-2.5000000000000004 cos(t) - 2.5000000000000004 sin(t), 2.5000000000000004 cos(t) - 2.5000000000000004 sin(t), 0), X = (4.440892098500626E-16, 2.220446049250313E-16, 4.330127018922193) + (-1.7677669529663689 cos(t) - 1.7677669529663689 sin(t), 1.7677669529663689 cos(t) - 1.7677669529663689 sin(t), 0), X = (2.220446049250313E-16, 0, 4.829629131445341) + (-0.9150635094610973 cos(t) - 0.9150635094610973 sin(t), 0.9150635094610973 cos(t) - 0.9150635094610973 sin(t), 0)}Sequence(Circle[(5; 0; (-15° * k)), (5; 90°; (-15° * k)), (5; 180°; (-15° * k))], k, 1, 5) → paralelosS, {X = (1.7763568394002505E-15, 0, -1.2940952255126037) + (-3.4150635094610955 cos(t) - 3.4150635094610955 sin(t), 3.4150635094610955 cos(t) - 3.4150635094610955 sin(t), 0), X = (8.881784197001252E-16, 4.440892098500626E-16, -2.4999999999999996) + (-3.0618621784789726 cos(t) - 3.0618621784789726 sin(t), 3.0618621784789726 cos(t) - 3.0618621784789726 sin(t), 0), X = (0, 0, -3.5355339059327373) + (-2.5000000000000004 cos(t) - 2.5000000000000004 sin(t), 2.5000000000000004 cos(t) - 2.5000000000000004 sin(t), 0), X = (4.440892098500626E-16, 2.220446049250313E-16, -4.330127018922193) + (-1.7677669529663689 cos(t) - 1.7677669529663689 sin(t), 1.7677669529663689 cos(t) - 1.7677669529663689 sin(t), 0), X = (2.220446049250313E-16, 0, -4.829629131445341) + (-0.9150635094610973 cos(t) - 0.9150635094610973 sin(t), 0.9150635094610973 cos(t) - 0.9150635094610973 sin(t), 0)}Segment((0, 0, 0), (5; 0; 0)) → radioSphere((0, 0, 0), 5) → esferaTextfield(ALon) → InputBox1Textfield(ALat) → InputBox2Textfield(BLon) → InputBox3Textfield(BLat) → InputBox4Angle(B, C, A) → CentralSegment(A, C) → fSegment(B, C) → gCircleArc(C, B, A) → c
AI Drawing Prompt Reference
Draw a globe with four cities marked: Rio de Janeiro (316.77°E, -22.9°S), Madrid (353.89°E, 43.49°N), Los Angeles (286°E, 40.72°N), and New York (316.77°E, 40.72°N). Use latitude and longitude to define these points and connect them with arcs and great circles to show the equator, polar circles, and tropics. Draw the Greenwich meridian on the globe and label the cities.
The prompt above was compiled from the original drawing commands and is for reference only.