
Plotting Graphs
Loading the math board and drawing, please wait…
This example demonstrates how to plot lines and simple curves. It involves core math concepts like function graphing, coordinate geometry, and geometric construction. Key GeoGebra commands and objects used include Sequence, If, Textfield, and various lists (list1-list10), variables (a, b, c), etc. Suitable for high school students learning function graphing and geometric transformations.
GeoGebra Commands & Parameters
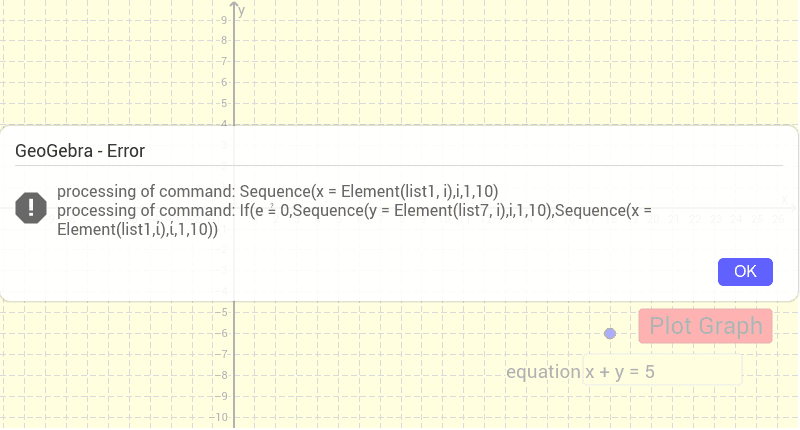
Sequence(x = Element[list1, i], i, 1, 10) → list2Sequence(Intersect[a, Element[list2, i]], i, 1, 10) → list3If(d ≟ d, 1, 0) → eIf(e ≟ 0, Sequence[y = Element[list7, i], i, 1, 10], Sequence[x = Element[list1, i], i, 1, 10]) → list8Sequence(Intersect[a, Element[list8, i]], i, 1, 10) → list9Sequence(Segment[Element[list9, i], Element[list4, i]], i, 1, 10) → list10Textfield(a) → inputBox1Sequence(Segment[Element[list3, i], Element[list4, i]], i, 1, 10) → list5Sequence(If[Element[list10, i] ≟ 0, 1, 0], i, 1, 10) → list6If(e ≟ 1, Intersect[a, c], (x(Element[list9, 1]), b)) → L
AI Drawing Prompt Reference
Plot a function graph demonstrating coordinate geometry and geometric construction, involving sequences of points and lines, conditional calculations, and intersection computations to form complex curves and shapes, resulting in a dynamic geometric structure.
The prompt above was compiled from the original drawing commands and is for reference only.