
Logs and Exponential Functions by Kristen Houdek
Loading the math board and drawing, please wait…
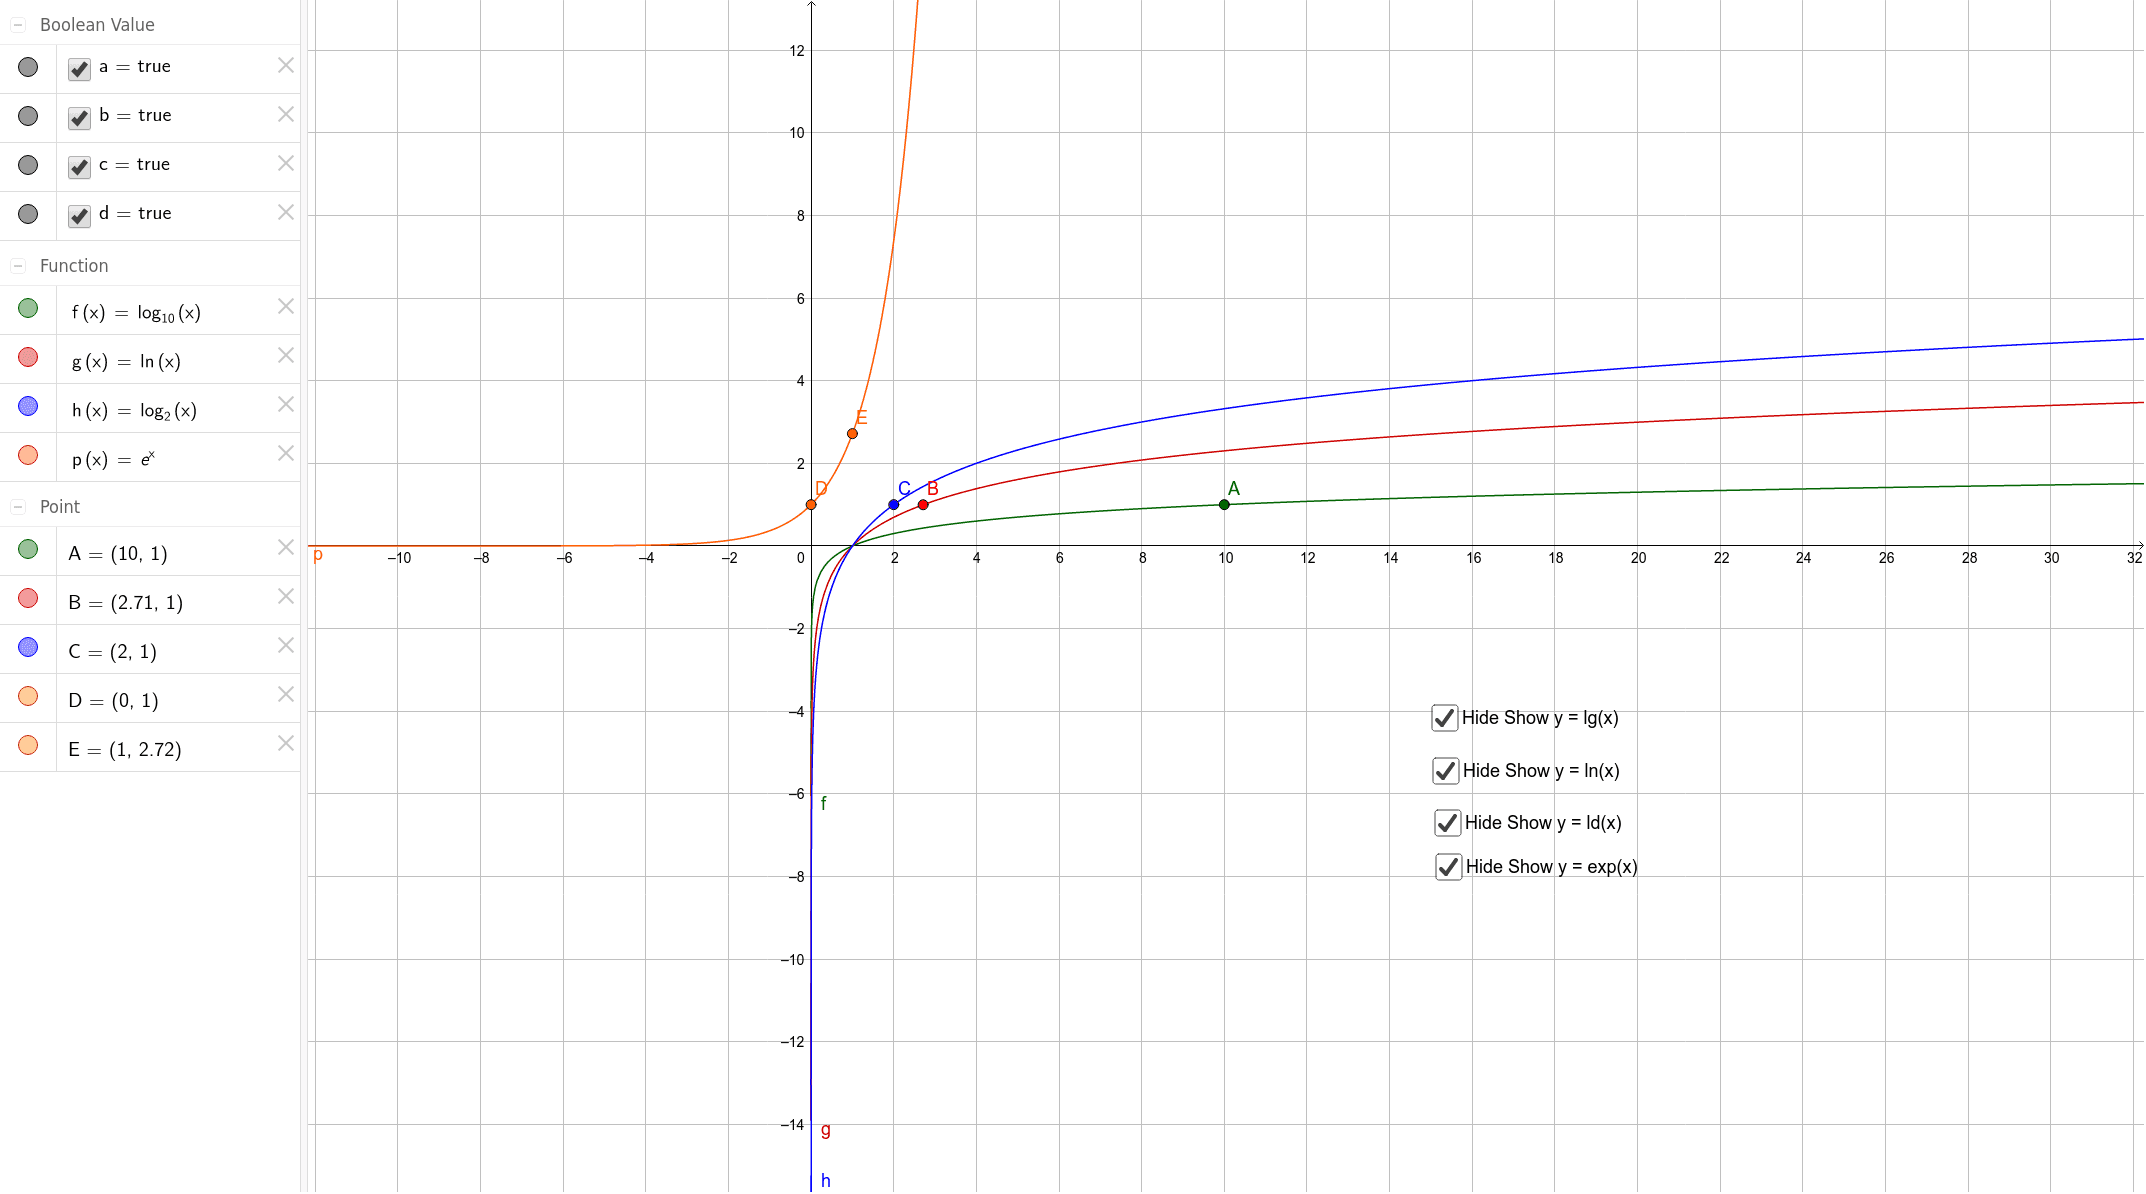
This example demonstrates the graphs and properties of logarithmic and exponential functions. It involves core math concepts like logarithmic functions, exponential functions, function graph transformations, sequences, and geometric shapes. GeoGebra commands and objects used include f, g, h, p, A, B, C, D, E, a, b, c, d for plotting functions and geometric elements. Suitable for high school mathematics teaching and learning to understand function properties and graph transformations.
GeoGebra Commands & Parameters
f(x) = lg(x)g(x) = log(x)h(x) = ld(x)p(x) = exp(x)(10, lg(10))(2.71, log(2.71))(2, ld(2))(0, ℯ^(0))(1, ℯ^(1))Boolean a(true)Boolean b(true)Boolean c(true)Boolean d(true)
AI Drawing Prompt Reference
Draw a coordinate plane with four basic function graphs: a base-10 logarithmic curve, a natural logarithmic curve, a base-2 logarithmic curve, and a natural exponential curve. The logarithmic curves rise from right to left, passing through (1,0), while the exponential curve rises steeply from left to right, passing through (0,1). Mark key points on each curve: the log curves pass through (10,1), (2.71,1), and (2,1) respectively, and the exponential curve passes through (0,1) and (1,e). Use distinct colors for each curve, keep axes clear, and optionally add a grid. Show the overall shapes and relative positions of these functions.
The prompt above was compiled from the original drawing commands and is for reference only.