
2D Vectors & Fractal Geometry Scatter Plot Example
Loading the math board and drawing, please wait…
In collections
Mapping Diagrams: From AB to C&DE, Resource
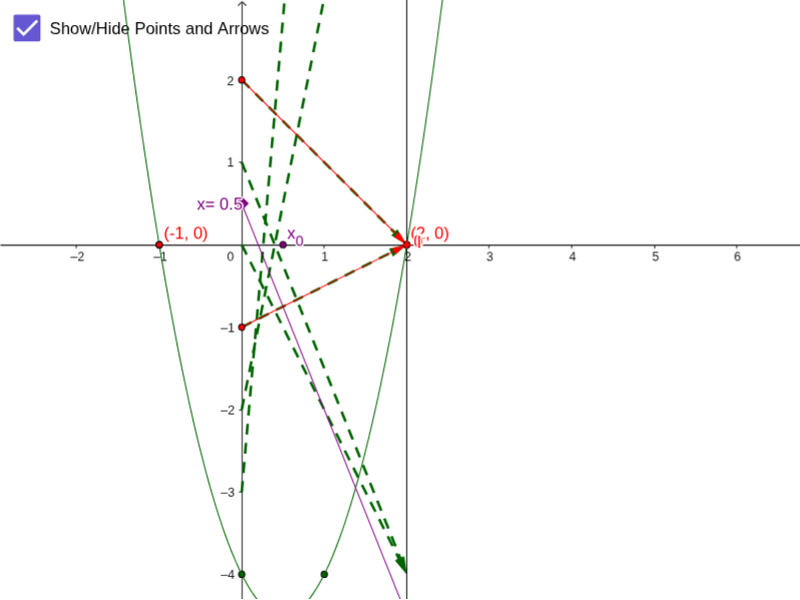
This example demonstrates the creation of a scatter plot integrating 2D vectors and fractal geometry. It involves core math concepts like special points, scatter plots, rational numbers, fractal geometry, and 2D vectors. Construction highlights include using GeoGebra commands like Root, Point, Textfield, Vector, Sequence, and Zip. Suitable for high school and above mathematics education and exploration.
GeoGebra Commands & Parameters
Root(f) → B, DPoint(yAxis) → ATextfield(f) → inputBox1Vector(H, F) → wVector(C, I) → vSequence(num) → NVector(A, E) → uZip((k, f(k)), k, N - num / 2) → list3Zip(Vector[(0, k), (2, f(k))], k, N - num / 2) → list2