
Quiz on Gradient of Line (1)
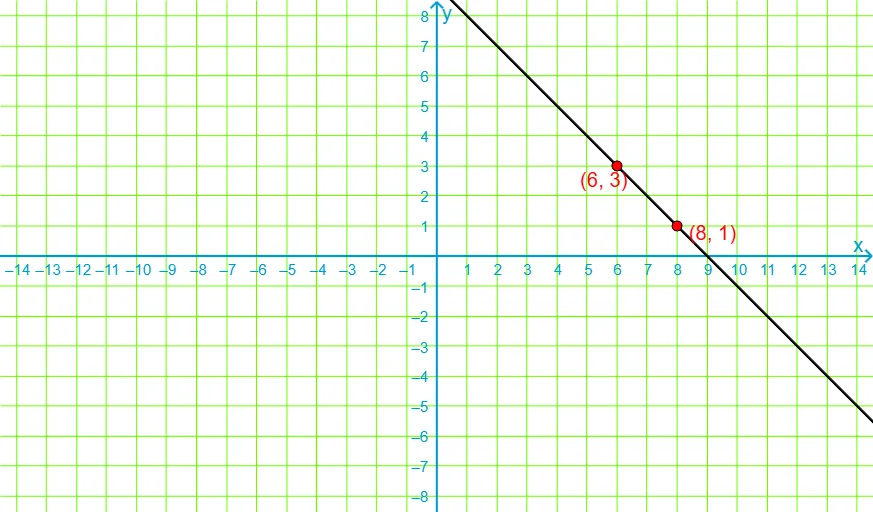
Loading the math board and drawing, please wait…
① This interactive quiz demonstrates how to calculate and identify the gradient (slope) of a straight line given two points on it. ② The core mathematical concept is the slope formula in coordinate geometry: the ratio of the vertical change to the horizontal change, covering positive, negative, zero, and undefined slopes. ③ Construction highlights: GeoGebra commands such as Random generate random points, Line constructs the line, Point marks points, Vector shows direction, Polygon and Dilate assist visual elements, Sequence and Shuffle create randomized answer choices, Append and Element manage lists, buttons (buttonNext, buttonCheck) control the quiz flow, and language switching (lang) with hints (hint) are included. ④ Suitable for middle and high school students learning linear functions, and useful for classroom interactive practice or self-assessment.
GeoGebra Commands & Parameters
Append("?", Sequence[Text[(-i)], i, -22, 22]) → listTextXAppend("?", Sequence[Text[(-i)], i, -14, 14]) → listTextYMax({maxX - minX, maxY - minY}) → maxSequence(i, i, -22, 22) → listXElement(listX, SelectedIndex[listTextX] - 1) → xSelectedSequence(i, i, -14, 14) → listYElement(listY, SelectedIndex[listTextY] - 1) → ySelectedShuffle(Sequence[i, i, minX, maxX]) → xList, {8, 6, 4, 7, -3, 1, 3, 10, -2, 0, -9, 5, -1, -8, -7, 2, 11, -4, -6, 9, -10, -5, -11}Element(xList, 1) → a_1Element(xList, 2) → a_2Random(minY, maxY) → b_2Random(minY, maxY) → b_1Line(P, Q) → LPoint(L) → APoint(L) → BPolygon(A, B, If[x(B) > x(A), (x(B), y(A)), (x(A), y(B))]) → slope, a, b, cSequence(Translate[slope, Vector[(i * Vector[A, B])]], i, -20, 20) → listSlopeDilate(N, If[0 < s ≤ 1, s, 1], A) → A'Vector(A, A') → v_uDilate(B, If[1 < s ≤ 2, s - 1, 1], N) → B'Vector(N, B') → v_v
AI Drawing Prompt Reference
Create an interactive quiz graphic showing a straight line on a coordinate plane, determined by two random points marked on it. Display direction vectors along the line, and repeat several congruent right triangles along the line to illustrate the slope. Below the graph, show four shuffled answer choices for the slope value (positive, negative, zero, or undefined). Include buttons for checking the answer and moving to the next question, plus a language toggle and hint feature. The axes have labeled tick marks with adjustable ranges.
The prompt above was compiled from the original drawing commands and is for reference only.