
Interactive Demonstration of Variance, Conic Sections, and Scatter Plots
Loading the math board and drawing, please wait…
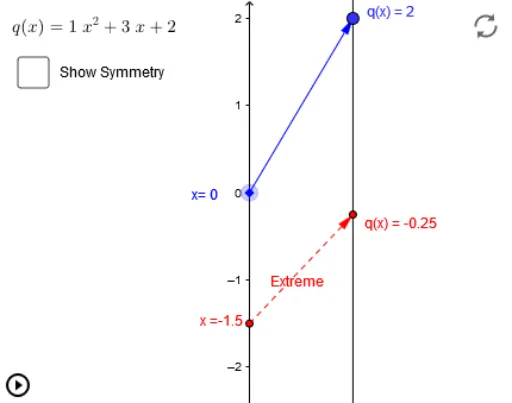
This example demonstrates the relationship between variance, conic sections, and scatter plots interactively, revealing the connection between data distribution and geometric shapes. Core mathematical concepts include variance calculation, conic section equations, scatter plot drawing, geometric terms, and general quadrilateral properties. Construction highlights involve using GeoGebra commands like Point, Vector, and Textfield to create objects such as E, B, A_1, A, C, function f, target point targ, and vector u, with sliders and buttons for dynamic interaction. Suitable for high school and above learners to understand the integration of data analysis and geometric graphics.
GeoGebra Commands & Parameters
Point(yAxis) → A_1Vector(A_1, B_1) → uTextfield(f) → inputBox1Vector(G, H) → ExtremeVector(F, B_1) → vVector(I, q_x) → wVector(q_x, I) → z