
GeoGebra Demo: Fractions & Linear Regression
Loading the math board and drawing, please wait…
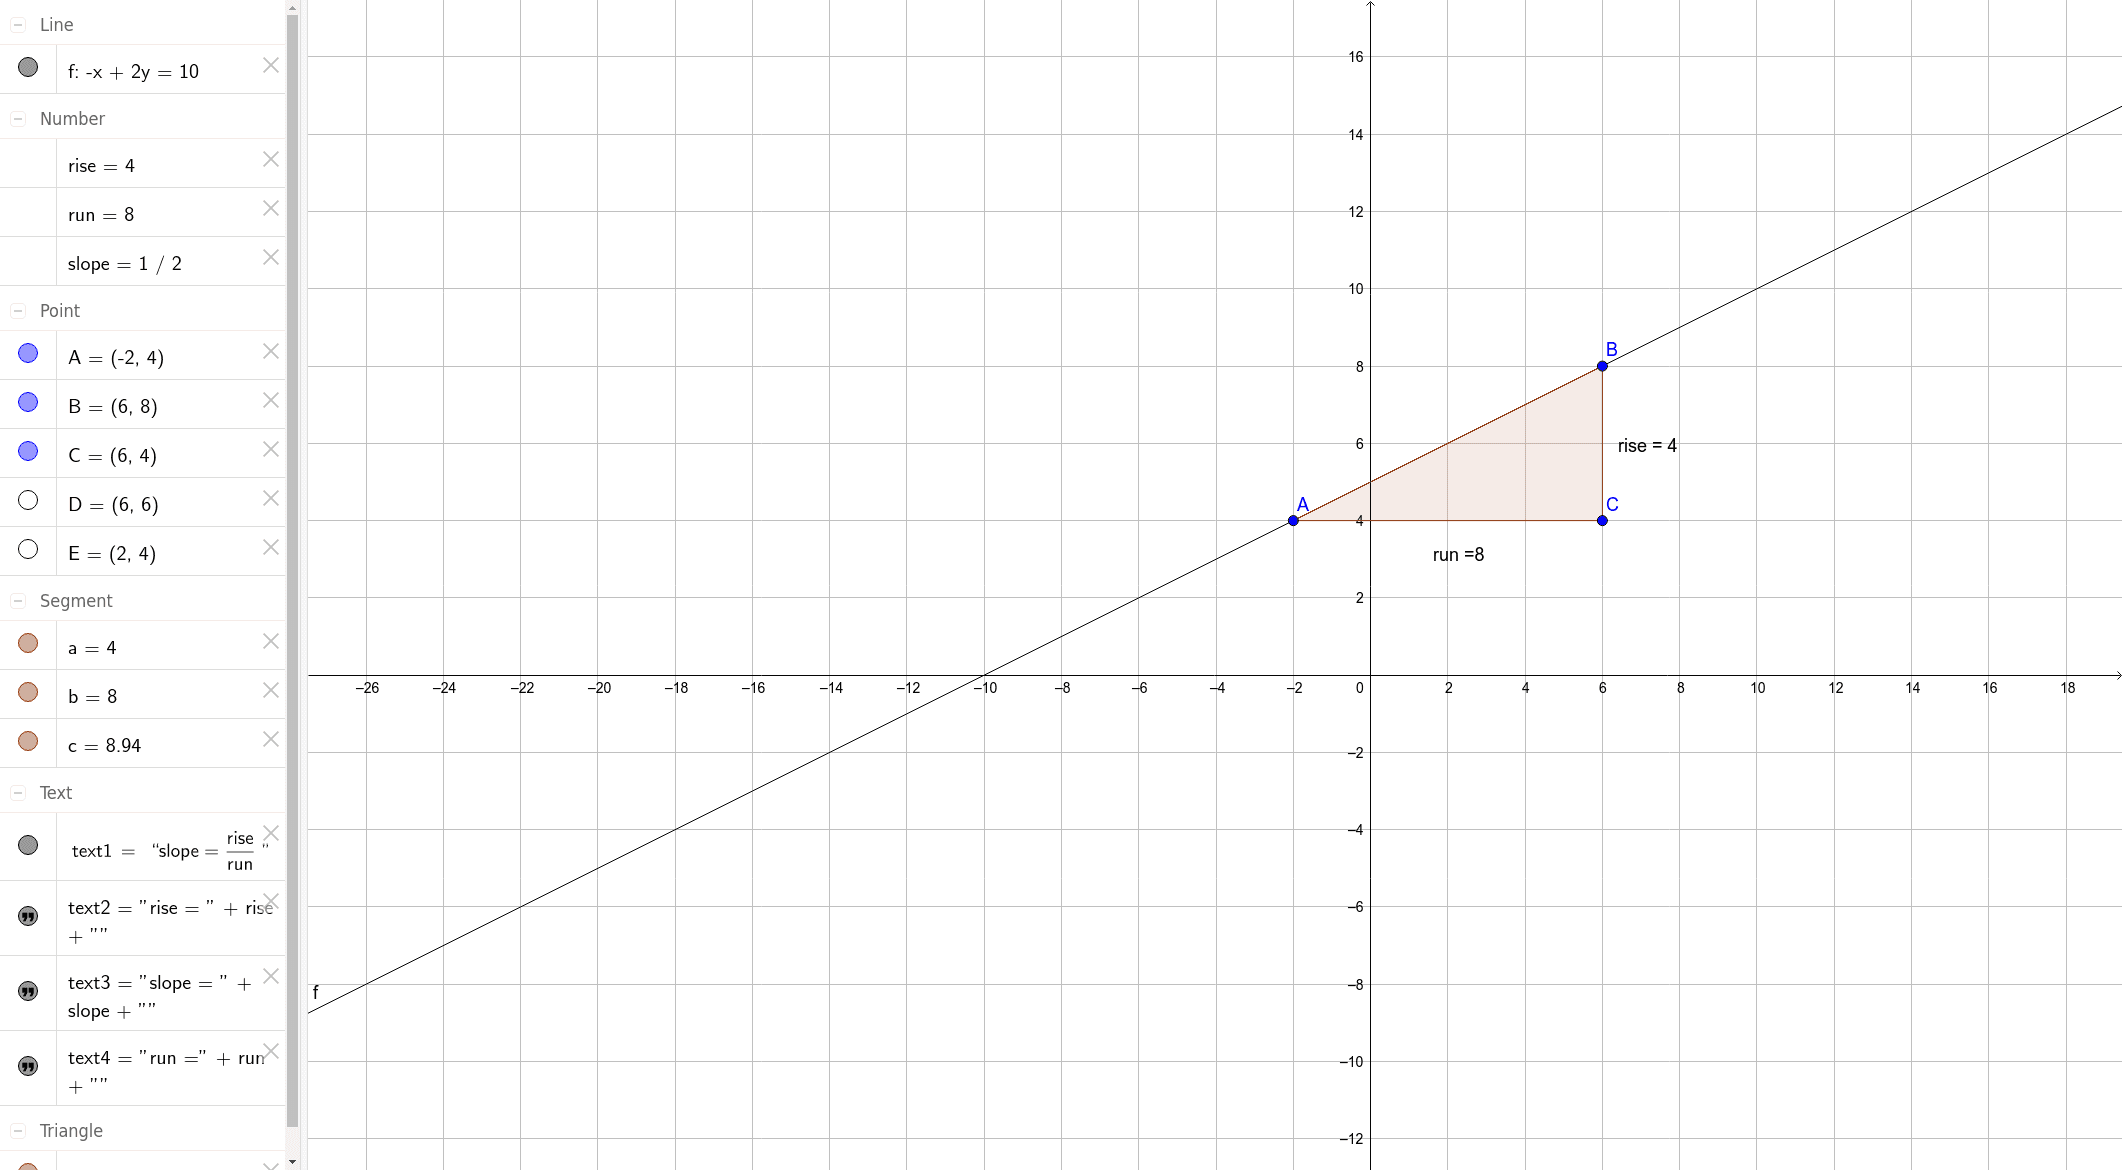
This example demonstrates the graphical representation of fractions, linear regression, and step functions using GeoGebra. It involves core mathematical concepts such as fraction operations, linear regression analysis, step function properties, combinatorics, special point identification, and conic sections. The construction utilizes GeoGebra commands like Line, Polygon, and Midpoint, along with objects like A, B, f, rise, run, slope, and various text and geometric elements. Suitable for middle school and above, it aids in understanding function graphs, geometric constructions, and data analysis.
GeoGebra Commands & Parameters
Line(A, B) → fPolygon(A, B, C) → poly1, c, a, bMidpoint(B, C) → DMidpoint(C, A) → E
AI Drawing Prompt Reference
Draw a coordinate plane with a straight line passing through two given points, representing a linear regression fit. Construct a triangle using these two points and a third point as vertices, and label its three sides. Then mark the midpoints of two sides of the triangle. Add visual elements related to fractions, linear regression, and step functions, such as text labels for slope, rise, and run, and highlight special points. The overall layout should clearly show the integration of geometric construction and data analysis.
The prompt above was compiled from the original drawing commands and is for reference only.