
Introduction to Loci in the Argand Diagram
Loading the math board and drawing, please wait…
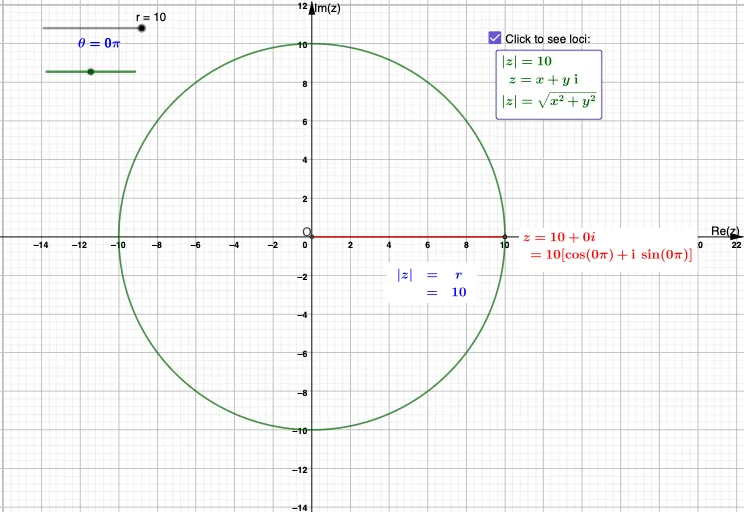
This GeoGebra example introduces loci in the Argand diagram (complex plane), demonstrating how complex points trace curves as parameters vary. It visualizes the correspondence between complex arithmetic and geometric loci, such as lines, circles, and conic sections. Core concepts include complex numbers, modulus and argument, geometric interpretation of addition, subtraction, multiplication, and division, and parametric equations of loci. The construction uses sliders (r, θ) to control the complex number z_1, along with commands like Point, Vector, Segment, Midpoint, Intersect, Angle, and SurdText to build points, vectors, segments, angles, and root-text labels. The object eq1 likely represents the locus equation. Suitable for high school or early university students learning complex numbers, and for teachers demonstrating visualizations of complex operations and their geometric traces.
GeoGebra Commands & Parameters
SurdText(a) → text1Intersect(xAxis, yAxis) → OSegment(O, B) → fMidpoint(f) → DPoint(xAxis) → EAngle(E, O, B) → αAngle(E, O, B) → βVector(B) → uSurdText(r) → text7