
Interpreting Piece-wise Linear Functions by Mark Beckwith (3)
Loading the math board and drawing, please wait…
In collections
Algebra 1
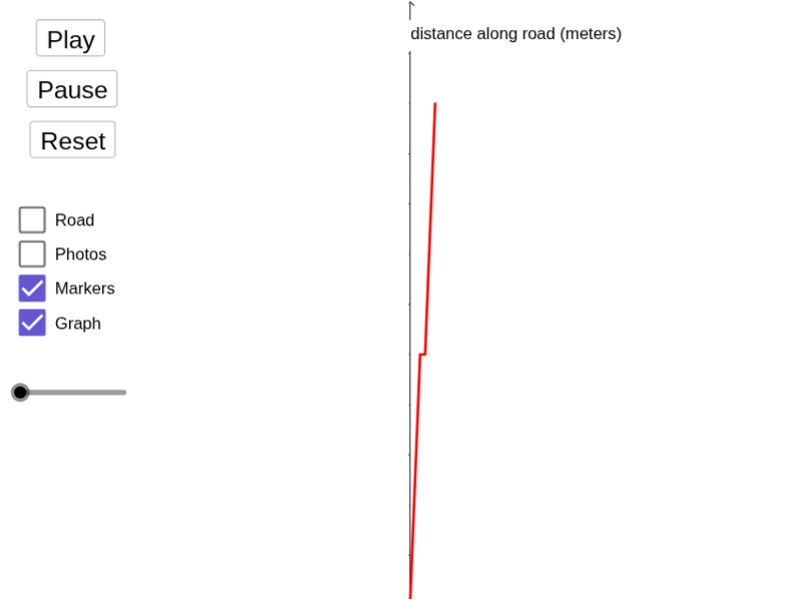
This example demonstrates the graphing and property analysis of piece-wise linear functions. Key math concepts include function domain, piece-wise definition, linear function graph characteristics, and analytical geometry plotting. Constructed using GeoGebra commands like Sequence and Segment for segmenting and connecting function parts. Suitable for high school mathematics teaching to understand function properties and graphing techniques.
GeoGebra Commands & Parameters
Sequence((n, g(n)), n, 0, t_1) → list2Segment((-1.9, 0), (-1.1, 0)) → road_0Sequence(i - 0.4 < x < i + 0.4, i, 0, t_1) → photo_{road}Sequence(x = i - 0.4, i, 0, t_1) → left_{road}Sequence(x = i + 0.4, i, 0, t_1) → right_{road}Sequence(x = i, i, 0, t_1) → mid_{road}Sequence(Translate[car_p, Vector[(0, g(0)), (i - g_y(i), g(i))]], i, 0, t_1) → photo_rSegment((-1.9, 200), (-1.1, 200)) → road_{200}
AI Drawing Prompt Reference
Draw a graph of a piecewise linear function, showing its domain and linear characteristics. Include a horizontal line segment at y=0 and y=200, and multiple segmented line segments connecting to form the function. Use dashed lines to indicate the definition intervals of each piece. An animated car icon moves along the segmented lines, marking the breakpoints of the function. Use a slider to control the number of pieces and function values.
The prompt above was compiled from the original drawing commands and is for reference only.