
Exponential Growth Model Demonstration
Loading the math board and drawing, please wait…
In collections
Algebra 1
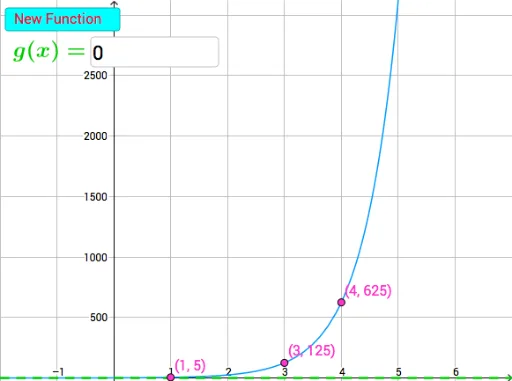
This example dynamically visualizes the graph and properties of an exponential growth function. Key math concepts include exponential functions, derivatives, definite integrals, matrix operations, and 3D shape representation. Construction highlights involve using GeoGebra commands like Textfield, button1, sliders, list1, list2, InputBox1 to create an interactive interface, with parameters a, b controlling function shape, p_1, p_2, p_3 showing growth stages, and A, B, C defining 3D coordinates. Suitable for high school and above mathematics education to understand exponential growth in real-world applications and calculations.
GeoGebra Commands & Parameters
Textfield(g) → InputBox1
AI Drawing Prompt Reference
Create a dynamic visualization of an exponential growth function, including its graph, derivative, definite integral, matrix operations, and 3D shape representation. Use sliders and input boxes to interactively control parameters a and b for adjusting the function's shape, with points p_1, p_2, p_3 showing growth stages, and 3D coordinates A, B, C defining the shape. Suitable for high school and above education to understand exponential growth in real-world applications and calculations.
The prompt above was compiled from the original drawing commands and is for reference only.