
Exponential Decay
Loading the math board and drawing, please wait…
In collections
Algebra 1
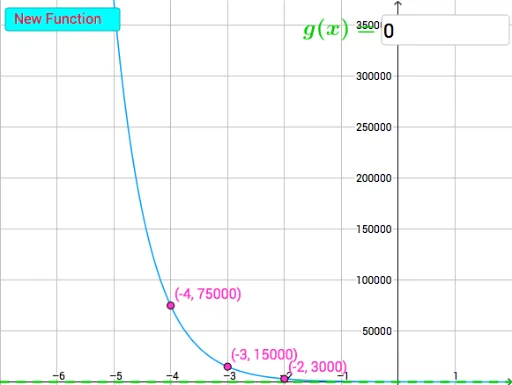
This example demonstrates exponential decay. It involves core mathematical concepts such as exponential functions and decay rates. Using GeoGebra commands like Textfield, button1, a, b, f, etc., you can dynamically adjust parameters and observe changes in the exponential function graph. Suitable for high school mathematics education and learning.
GeoGebra Commands & Parameters
Textfield(g) → InputBox1
AI Drawing Prompt Reference
Draw a graph demonstrating exponential decay, including an input box for adjusting parameters to observe changes in the exponential function graph, reflecting core mathematical concepts of exponential functions and decay rates, suitable for high school mathematics education.
The prompt above was compiled from the original drawing commands and is for reference only.