
Graphing Sine and Cosine Functions by Mark Beckwith
Loading the math board and drawing, please wait…
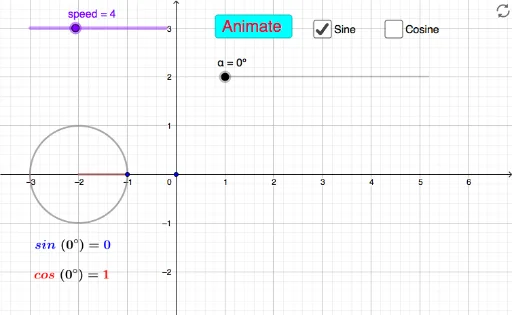
This example demonstrates the graphing of sine and cosine functions, highlighting their periodicity, amplitude, and phase shifts. It involves core mathematical concepts such as trigonometric functions, unit circle, and coordinate geometry. Constructed using GeoGebra commands like Circle, OrthogonalLine, Intersect, and Polygon, with objects including α, c, A, f, B, t1, g, a, b, C, text elements, button, and speed parameter. Ideal for high school students learning trigonometric graphs and transformations, or university-level foundational mathematics education.
GeoGebra Commands & Parameters
Circle((-2, 0), 1) → cOrthogonalLine(A, xAxis) → fIntersect(f, xAxis) → BPolygon(A, B, (-2, 0)) → t1, g, a, b