
Visual Quadratic Formula Explanation
Loading the math board and drawing, please wait…
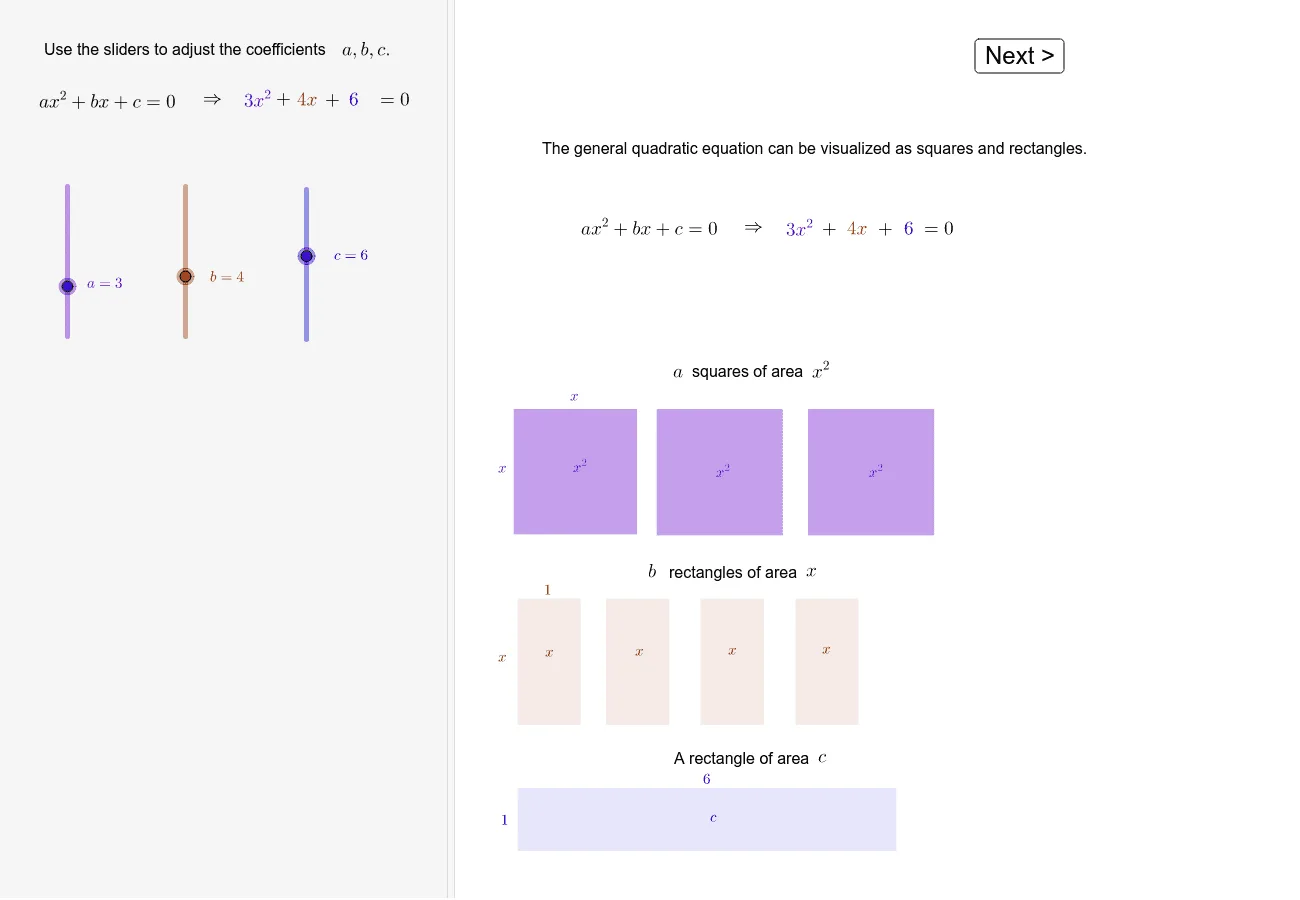
This example visually demonstrates the geometric meaning of the quadratic formula. It involves core math concepts like quadratic functions, discriminant, and coordinate geometry. Construction uses GeoGebra commands such as Polygon, Point, Segment, Distance with objects A, D, C, a, b, c. Suitable for high school mathematics teaching to help students intuitively understand the relationship between the roots of a quadratic equation and its graph.
GeoGebra Commands & Parameters
Polygon(A, B, C, D) → q1, a_1, b_2, c_2, dPolygon(E, F, G, H) → q2, e, f, g, hPolygon(I, J, K, L) → q3, i, j, k, lPolygon(M, N, O, P) → q4, m, n, o, pPolygon(Q, R, S, T) → q5, q, r, s, tPoint(yAxis) → UPoint(yAxis) → ZPolygon(Z, U, V, W) → q6, z_1, u, v, wPolygon(A_1, B_1, C_1, D_1) → q7, f_1, b_1, c_1, d_1Polygon(E_1, F_1, G_1, H_1) → q8, e_1, g_1, h_1, i_1Polygon(I_1, J_1, K_1, L_1) → q9, j_1, k_1, l_1, m_1Polygon(M_1, N_1, O_1, P_1) → q10, n_1, p_1, o_1, q_1Polygon(Q_1, R_1, S_1, T_1) → q11, r_1, s_1, t_1, f_2Polygon(Z_1, U_1, V_1, W_1) → q12, g_2, u_1, v_1, w_1Point(yAxis) → A_2Point(Circle[A_2, c]) → B_2Segment(A_2, B_2) → seg1Point(yAxis) → D_2Polygon(D_2, A_2, C_2, E_2) → q13, d_2, a_2, h_2, e_2Point(z_1) → F_2Point(z_1) → G_2Polygon(F_2, G_2, H_2, I_2) → q14, i_2, j_2, k_2, l_2Point(d_2) → J_2Point(d_2) → K_2Polygon(J_2, K_2, L_2, M_2) → q15, m_2, n_2, p_2, q_2Polygon(A, B, C, D) → q16, a_3, b_3, c_3, d_3Polygon(N_2, O_2, P_2, Q_2) → q17, r_2, o_2, s_2, t_2Polygon(R_2, S_2, T_2, W_2, U_2, V_2) → poly1, f_3, g_3, h_3, w_2, i_3, v_2Polygon(N_2, Z_2, A_3, Q_2) → q18, j_3, z_2, k_3, l_3Polygon(Z_2, O_2, P_2, A_3) → q19, m_3, n_3, p_3, q_3Polygon(C, K_3, N_3, B) → q21, t_3, e_3, s_4, t_4Polygon(D, B_3, C_3, C) → q20, d_4, r_3, s_3, c_4Polygon(D_3, E_3, F_3, I_3, G_3, H_3) → poly2, f_4, g_4, h_4, i_4, j_4, k_4Polygon(C, C_3, J_3, K_3) → q22, l_4, m_4, n_4, a_4Polygon(P_3, L_3, M_3, O_3) → q23, p_4, q_4, r_4, o_3Distance(S, T) → ST
AI Drawing Prompt Reference
Create a visual representation demonstrating the geometric meaning of the quadratic formula. Include a graph of a quadratic function and several polygons. Start by drawing a polygon with points A, B, C, D, then another with points E, F, G, H. Create two points U and Z on the y-axis and form a polygon with U, Z, and two new points V, W. Continue constructing multiple polygons based on these points to represent different parts of the quadratic formula. Finally, add a circle and connect relevant points with line segments to illustrate the geometric relationships and show the connection between the roots of the quadratic equation and its graph.
The prompt above was compiled from the original drawing commands and is for reference only.