
Interactive Venn Diagram: Hockey and Tennis Set Theory Problem
Loading the math board and drawing, please wait…
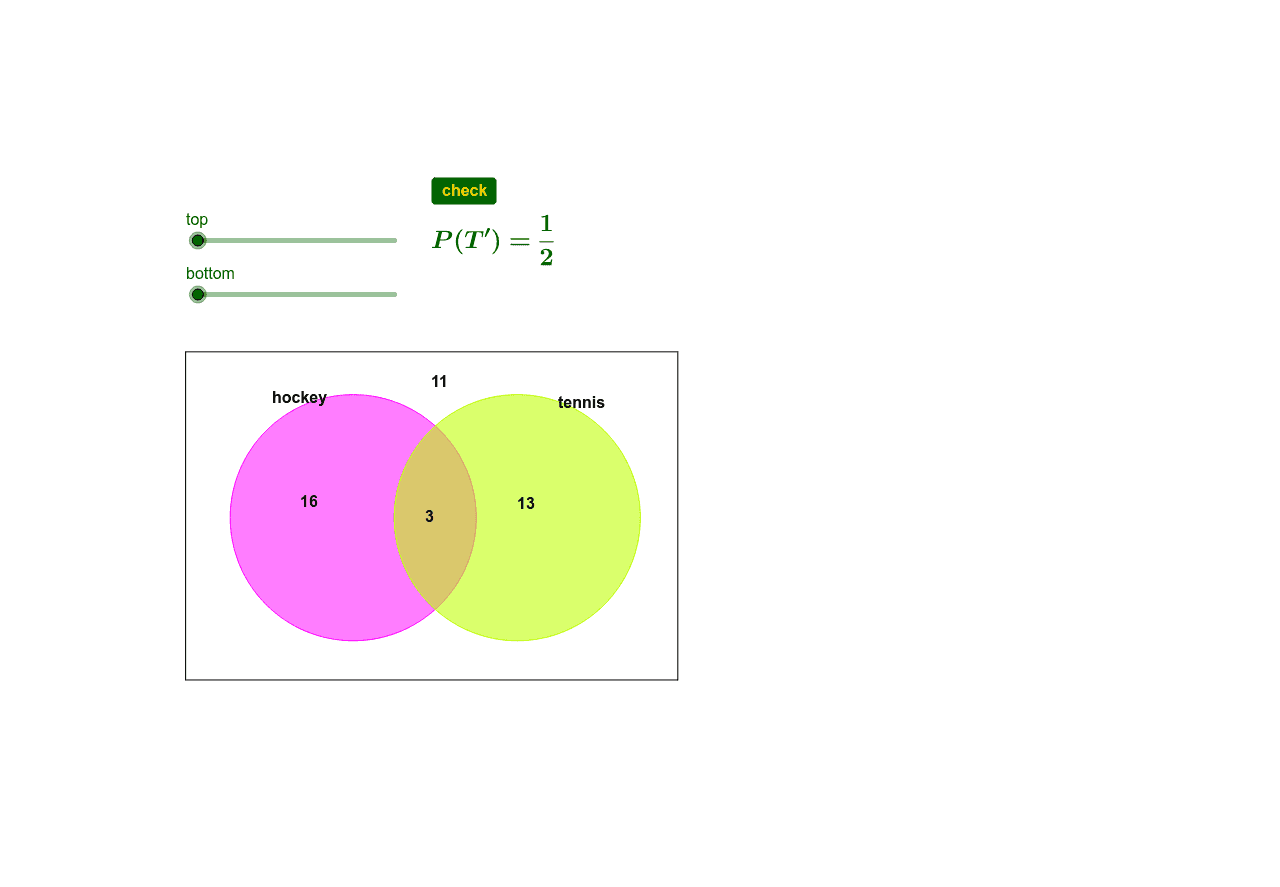
This GeoGebra example demonstrates an interactive Venn diagram problem based on sports participation, specifically hockey and tennis. The core mathematical concepts involve set theory, including intersections, unions, complements, and cardinality calculations to solve for participants playing both sports, only one, or neither. Key construction features include the use of Circle commands to draw the sets, Point, Segment, and Polygon to design the interactive layout and buttons, and If logic to handle user inputs and verify answers. It is highly suitable for high school set theory courses, introductory probability classes, or math competition training to visualize the principle of inclusion-exclusion.
GeoGebra Commands & Parameters
Polygon(B, C, D, A) → poly1, b, c, d, aPoint(xAxis) → ESegment(F, G) → eCircle(E, e) → fPoint(xAxis) → H_1Circle(H_1, e) → gIf(GCD[top, bottom] ≟ 1, "", "=" + (FractionText[top / bottom])) → question1
AI Drawing Prompt Reference
Draw an interactive Venn diagram showing participation in hockey and tennis. The diagram includes two circles representing hockey and tennis participants. There is an overlapping region for those who play both sports. Outside the circles, there are areas for those who play only one sport or none. The diagram should have interactive buttons and input fields for users to enter numbers and calculate intersections, unions, and complements. The construction order is to draw the circles first, then add the overlapping region, then add buttons and input fields, and finally add the calculation logic.
The prompt above was compiled from the original drawing commands and is for reference only.