
Interactive Systems of Linear Equations
Loading the math board and drawing, please wait…
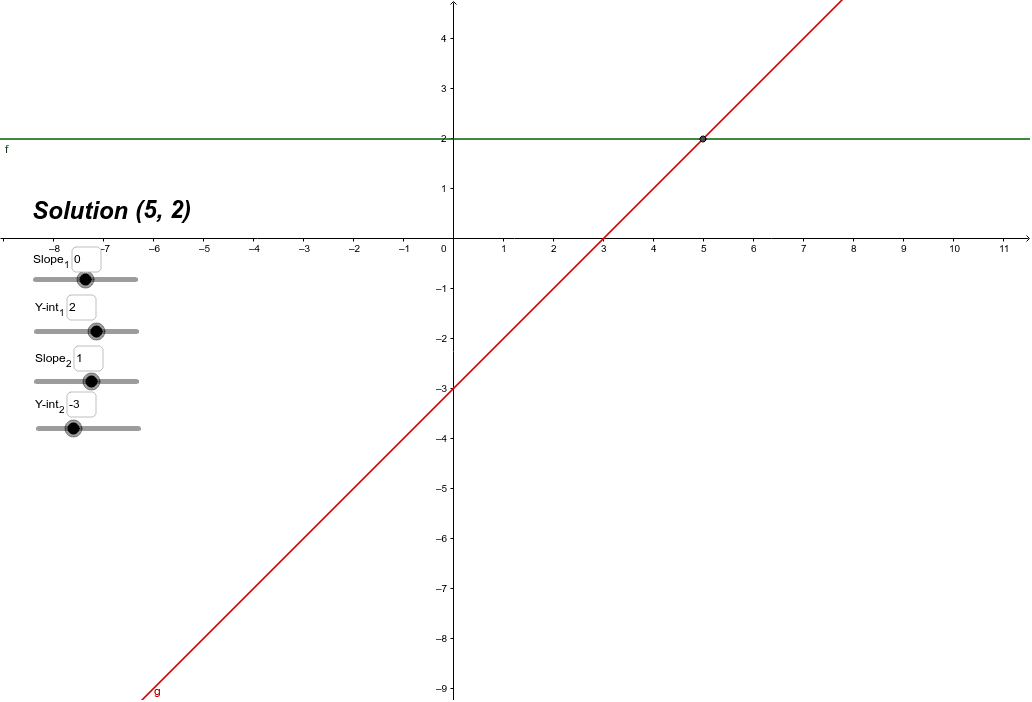
This GeoGebra example dynamically demonstrates the geometric meaning of a system of two linear equations: the intersection point of two lines. By adjusting the slope m, intercept b, and the second line's parameters m2 and b2 via input boxes, users can instantly see how the two lines and their intersection point A change, revealing the relationship between the solution (unique, none, or infinite) and the relative positions of the lines. Core mathematical concepts include linear equations, line equations, solving systems, intersection coordinates, and how parameter changes affect solutions. Construction highlights: the Intersect command computes the intersection point of the two lines, while four Textfield (input box) objects provide interactive parameter controls, with text objects text1 and text2 displaying the current equations and intersection coordinates. Suitable for middle and high school students learning linear functions and systems of equations, as well as for classroom demonstrations or self-directed exploration, bridging algebraic and geometric understanding.
GeoGebra Commands & Parameters
Intersect(f, g, 1) → ATextfield(m) → InputBox1Textfield(b) → InputBox2Textfield(m2) → InputBox3Textfield(b2) → InputBox4
AI Drawing Prompt Reference
Draw two lines with adjustable slopes and intercepts, showing their intersection point. Input boxes control the slope and intercept of the first line and the second line. Dynamically display the changes in the two lines and their intersection point, as well as the coordinates of the intersection point. Also, show the equations of the two lines and the intersection coordinates on the graph.
The prompt above was compiled from the original drawing commands and is for reference only.