
Interactive Graphs of y=a^x and y=log(a, x) with Inverse Symmetry
Loading the math board and drawing, please wait…
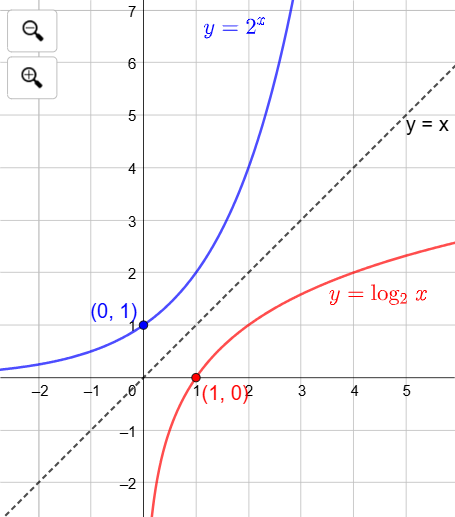
This GeoGebra example dynamically displays the graphs of the exponential function y=a^x and the logarithmic function y=log_a(x), with a slider to adjust the base a. It vividly illustrates that the two functions are inverses of each other, as their graphs are symmetric about the line y=x. Core mathematical concepts include exponential functions, logarithmic functions, inverse functions, reflection symmetry, and how parameter changes affect graph shape. The construction uses GeoGebra commands such as Sequence to generate point lists, Segment to draw the symmetry line, Mirror to reflect points across y=x, Vector for translations, Textfield and InputBox for user input, TableText to show numerical values, Intersect to find intersection points, If for conditional display, and multiple buttons (button1-3) for interactive control. Suitable for high school and above, this resource helps students understand the properties of exponential and logarithmic functions, the concept of inverse functions, and is ideal for classroom demonstrations or self-directed exploration of parameter effects.
GeoGebra Commands & Parameters
Sequence(Segment[(i, 0), (i, -0.1)], i, 1, 6) → l2Segment(Rotate[I, -90°, O], Rotate[I, 90°, O]) → kMirror(I, O) → I'Vector(I', I) → uSequence(Segment[O, Rotate[(R, 0), (i * 15°), O]], i, 0, 23) → l5Sequence(Circle[(0, 0), r], r, 1, R) → l4Sequence(Text[r, (r - 0.1, -0.5)], r, 1, R) → l1Textfield(f) → InputBox2Textfield(tLower) → InputBox3Textfield(tUpper) → InputBox4Point(g) → FPoint(f) → GTableText({x, text3_1}, {x(G), y(G)}, "|_") → text5TableText({x, text4}, {x(F), y(F)}, "|_") → text6Intersect(f, y = y(Corner[3]), (2.8498452444615525, 7.209230322399718)) → C1Intersect(f, x = x(Corner[3]), (5.951986496567596, 61.90510566908008)) → C2If(x(C1) < x(C2) ∧ a > 1, C1, C2) → CIntersect(g, x = x(Corner[3]), (5.951986496567596, 2.5733712533684807)) → D1Intersect(g, y = y(Corner[3]), (147.97712070438394, 7.209230322399718)) → D2If(x(D1) < x(D2), D1, D2) → D
AI Drawing Prompt Reference
Draw a dynamic graph showing the exponential function y=a^x and the logarithmic function y=log_a(x) with a slider for base a. Include the line y=x to illustrate symmetry. Generate point sets for both functions, reflect points across y=x, and connect them to form the curves, showing the inverse relationship.
The prompt above was compiled from the original drawing commands and is for reference only.