
Interactive Graphing Hyperbola Ex 3A
Loading the math board and drawing, please wait…
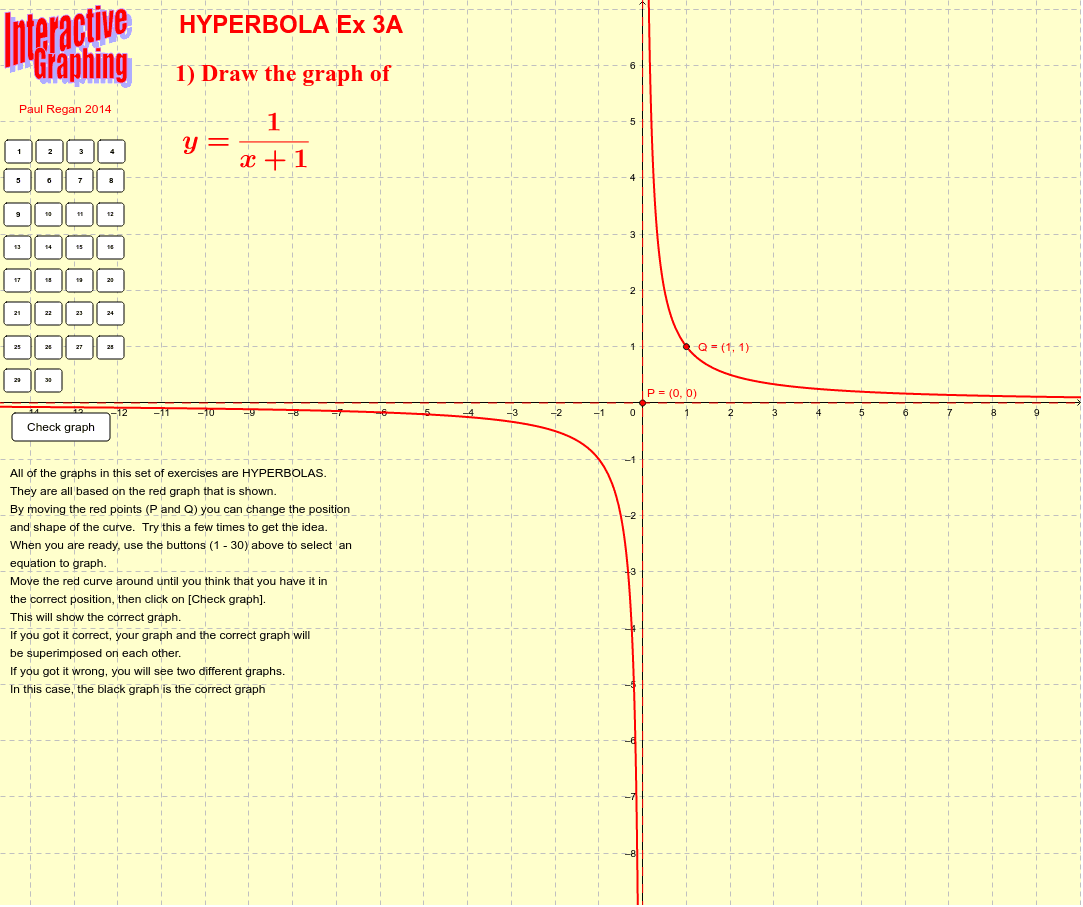
This example demonstrates interactive graphing of hyperbolas and their asymptotes. Core math concepts include hyperbola definition, asymptotes, and coordinate geometry. GeoGebra commands/objects used are Asymptote, pic1, buttons01-30, qx, qy, P, Q. Suitable for high school mathematics teaching to help students understand hyperbola properties and parameter variations.
GeoGebra Commands & Parameters
Asymptote(g) → list1
AI Drawing Prompt Reference
Draw a hyperbola with its two asymptotes. The hyperbola is centered at the origin, opening horizontally or vertically. The asymptotes are two straight lines passing through the origin, extending diagonally upward and downward, approaching the hyperbola but never intersecting it. Include a draggable point on the hyperbola to show the geometric relationship between the point and the asymptotes. Provide several buttons or sliders to adjust the hyperbola's parameters (such as the lengths of the transverse and conjugate axes), changing the shape of the hyperbola and the slopes of the asymptotes. The overall layout should be clear, emphasizing the hyperbola, asymptotes, and the interactive point.
The prompt above was compiled from the original drawing commands and is for reference only.