
Interactive Graphing Hyperbola Ex 1A
Loading the math board and drawing, please wait…
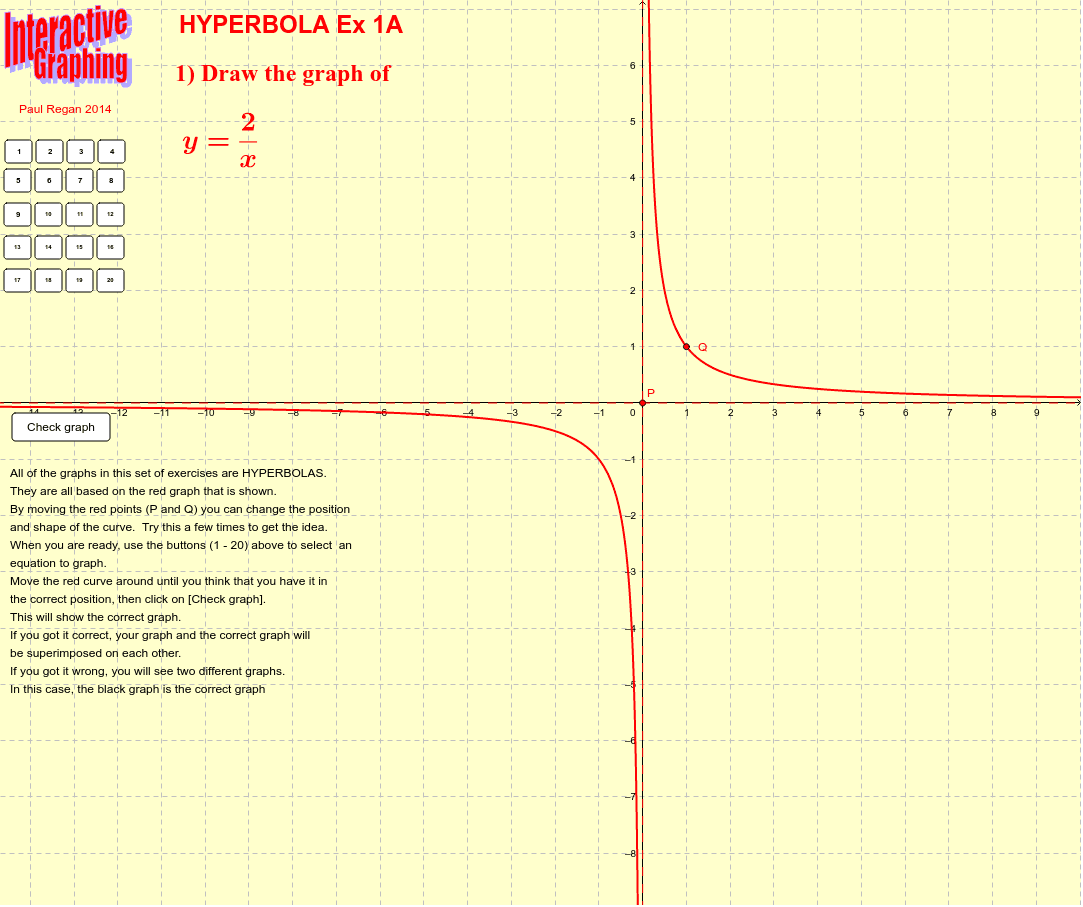
This example demonstrates interactive graphing of hyperbolas and their asymptotes. Key math concepts include the definition of hyperbolas, properties of asymptotes, and parametric equations in analytical geometry. Construction highlights involve using GeoGebra commands like Asymptote, along with numerous buttons (button01-30) and objects (pic1, ex, fl) for interactivity. Suitable for high school analytical geometry teaching to help students visually understand geometric properties and the impact of parameter changes.
GeoGebra Commands & Parameters
Asymptote(g) → list1