
Interactive Hyperbola Graphing Example 4A
Loading the math board and drawing, please wait…
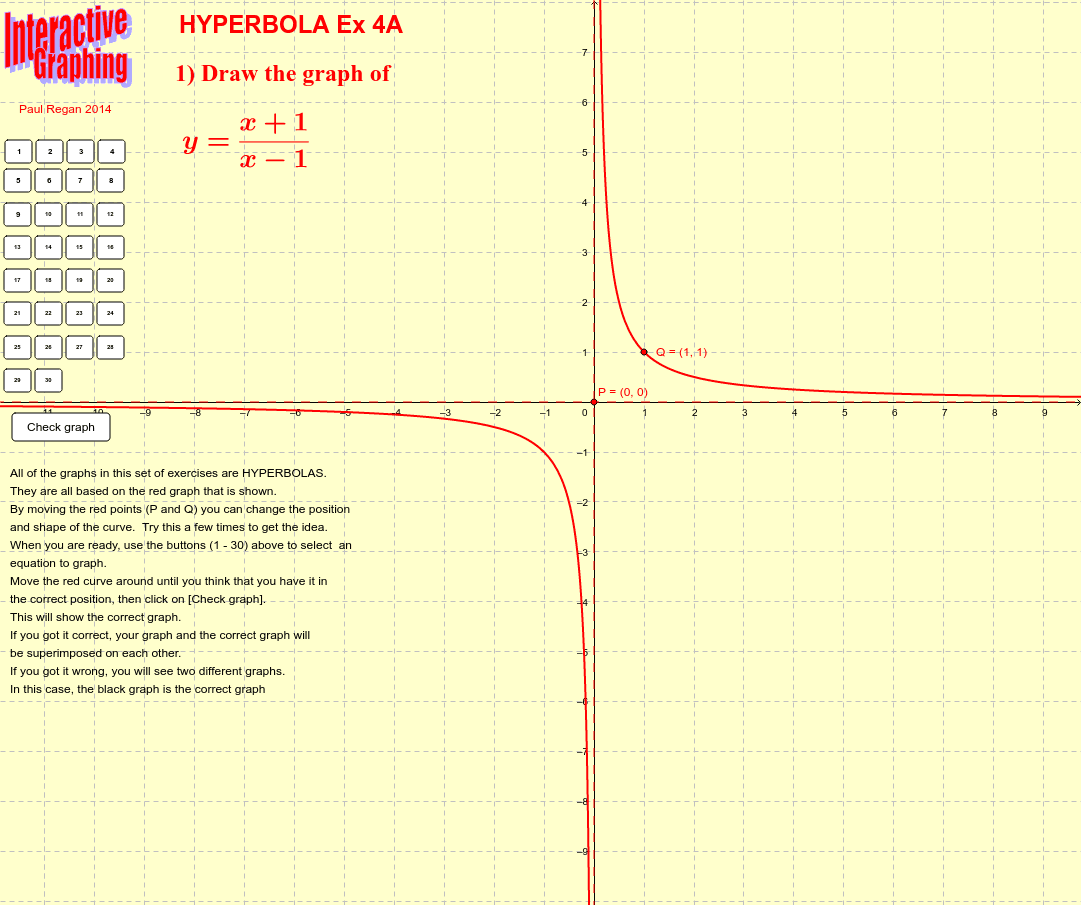
This example demonstrates interactive graphing of hyperbolas and their asymptotes. Key math concepts include hyperbola definition, asymptotes, vertices, and foci. Construction highlights involve GeoGebra commands like Asymptote, button controls (button01 to button30), and objects like pic1. Suitable for high school coordinate geometry teaching to visually understand hyperbola properties and parameter changes.
GeoGebra Commands & Parameters
Asymptote(g) → list1
AI Drawing Prompt Reference
Draw a hyperbola with its asymptotes, showing key features like vertices and foci, with sliders to adjust parameters. Use dashed lines for asymptotes and buttons to toggle visibility of elements such as asymptotes, vertices, and foci for interactive exploration, suitable for high school coordinate geometry teaching.
The prompt above was compiled from the original drawing commands and is for reference only.