
Interactive Graphing Hyperbola Ex 2A
Loading the math board and drawing, please wait…
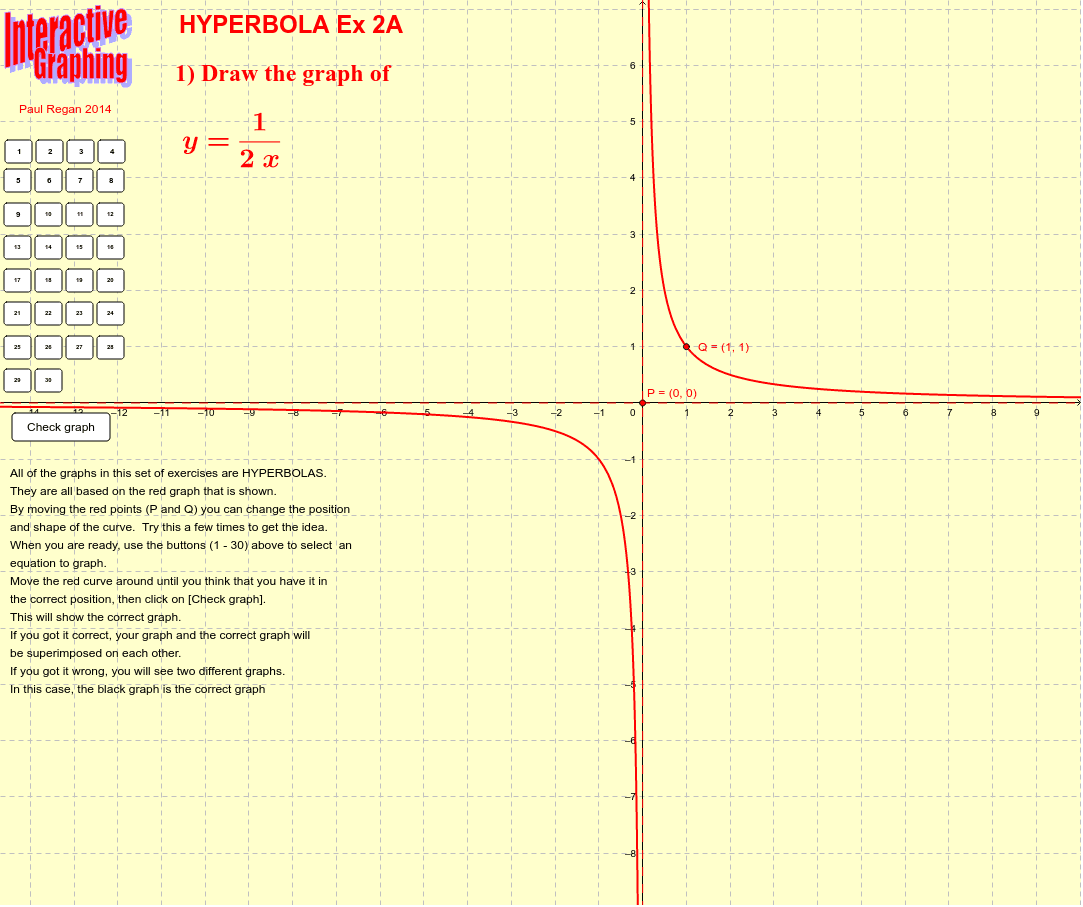
This example demonstrates interactive graphing of hyperbolas and their asymptotes. Core math concepts include hyperbola definition, asymptote properties, rotation, geometric relations of cones and cylinders, cosine function application, and conditional probability. Construction highlights involve the Asymptote command for asymptotes, multiple interactive buttons (button01-30), and geometric objects like f, g, qx, qy, P, Q. Suitable for high school and above mathematics education, focusing on analytical geometry concepts of hyperbolas and related properties.
GeoGebra Commands & Parameters
Asymptote(g) → list1
AI Drawing Prompt Reference
Draw a hyperbola with its asymptotes, where the asymptotes are defined by specific function relationships, showcasing the geometric properties of the hyperbola and its relation to cones and cylinders, while applying concepts of the cosine function and conditional probability. Use multiple interactive buttons to control the rotation and parameter changes of the graph, suitable for high school and above mathematics education focusing on analytical geometry concepts of hyperbolas and related properties.
The prompt above was compiled from the original drawing commands and is for reference only.