
Interactive Graphing Hyperbolas Ex 1B
Loading the math board and drawing, please wait…
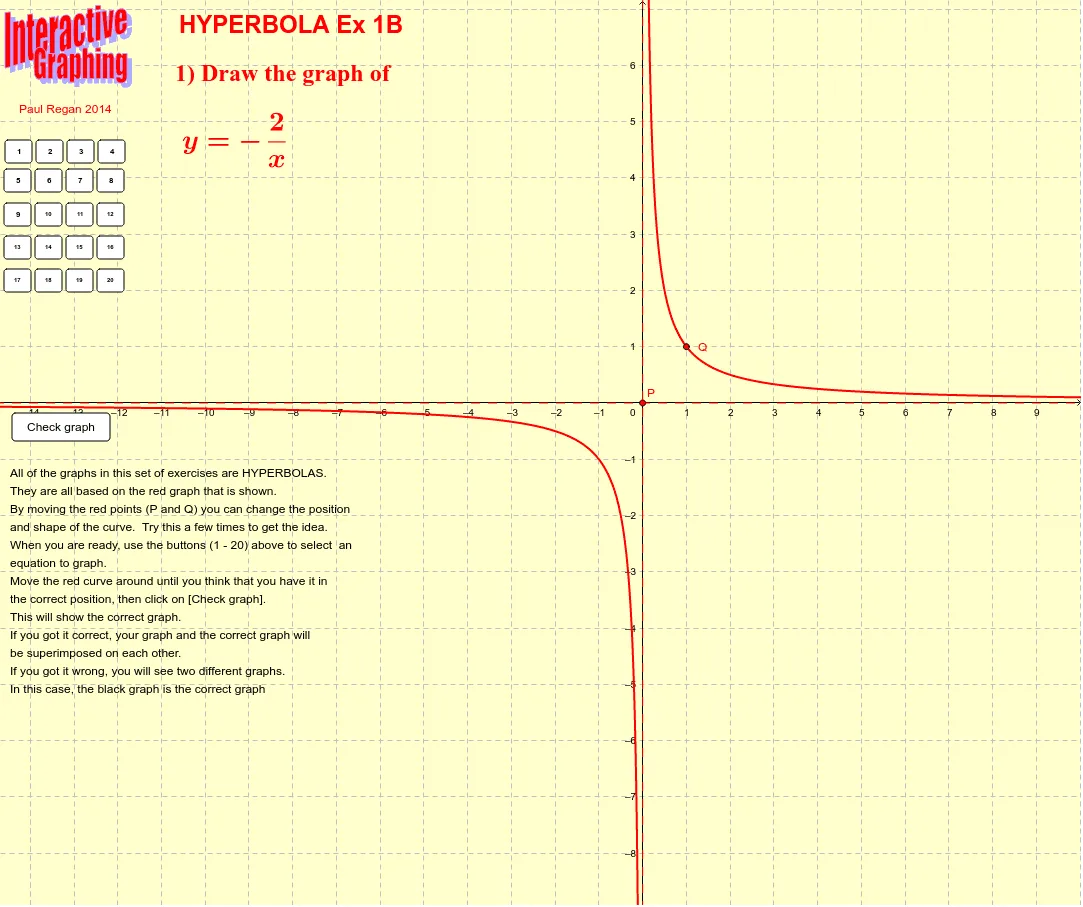
This example demonstrates the plotting and properties of hyperbolas. Key mathematical concepts include the definition of a hyperbola, asymptotes, and eccentricity. Construction involves using GeoGebra commands like Asymptote, defining the hyperbola equation, and setting parameters. Suitable for high school or undergraduate students for geometry learning and practice.
GeoGebra Commands & Parameters
Asymptote(g) → list1
AI Drawing Prompt Reference
Draw a hyperbola graph. The hyperbola consists of two curves that extend infinitely in the coordinate system. It has two asymptotes, which are straight lines that approach the hyperbola but never intersect. The center is at the origin, and the foci are on either side of the center. To draw it, first draw the asymptotes, then the hyperbola, ensuring symmetry on both sides of the asymptotes. Keep the graph clear and label key points like the center and foci.
The prompt above was compiled from the original drawing commands and is for reference only.