
Identifying Populations & Samples
Loading the math board and drawing, please wait…
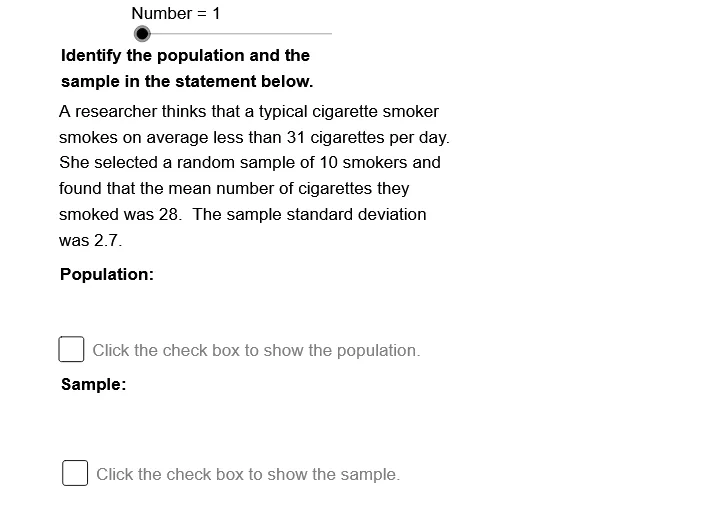
This example demonstrates how to identify populations and samples. Key mathematical concepts include statistics. Construction highlights the use of multiple GeoGebra commands such as RS12, RS11, RS08, etc. Suitable for statistics education.
GeoGebra Commands & Parameters
Numeric Number(1)Boolean a(false)Boolean b(false)Point RSLc(1, 5.4){RS01, RS02, RS03, RS04, RS05, RS06, RS07, RS08, RS09, RS10, RS11, RS12}{Sm01, Sm02, Sm03, Sm04, Sm05, Sm06, Sm07, Sm08, Sm09, Sm10}(1, 1.5)(1, -0.9){Pp01, Pp02, Pp03, Pp04, Pp05, Pp06, Pp07, Pp08, Pp09, Pp10, Pp11, Pp12}
AI Drawing Prompt Reference
Draw a statistical graph with 10 sample points and 10 population points. Sample points are located between (1, 1.5) and (1, -0.9), while population points are around (1, 5.4). Use RS08 to RS12 commands to draw sample points and RS01 to RS07 commands to draw population points.
The prompt above was compiled from the original drawing commands and is for reference only.