
Hypothesis Test Power Analysis by David Gurney
Loading the math board and drawing, please wait…
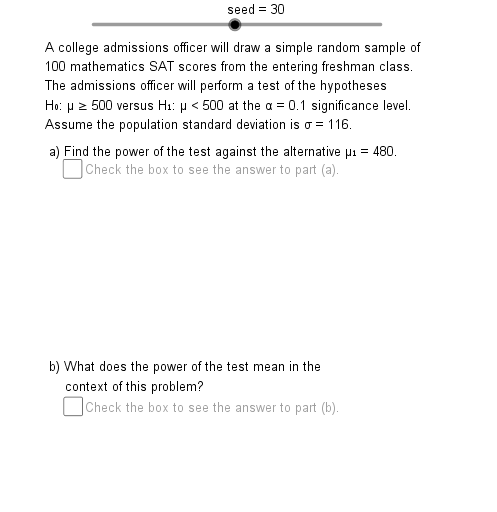
This example demonstrates how to analyze the power of a hypothesis test by adjusting its parameters. Key mathematical concepts include hypothesis testing and power analysis in probability & statistics. GeoGebra commands such as Mod, Element, If, and Normal are used to construct the graph. Suitable for high school or university statistics courses.
GeoGebra Commands & Parameters
Mod((seed * RndFct), Cmpst) → Nmb1Element(Z1TSq, Chc3) → Zc1TElement(Z2TSq, Chc3) → Zc2TIf(Chc2 < 3, Zc1T, Zc2T) → ZcElement(MuSq, Chc1) → Mu0Element(NSq, Chc1) → NElement(SDSq, Chc1) → SDElement(AccSq, Chc1) → AccIf(Mod[Chc2, 2] ≟ 0, Mu1L, Mu1R) → Mu1If(Mod[Chc2, 2] ≟ 0, Xcl, Xcr) → XcElement(IE1Sq, Chc2) → IE1Element(IE2Sq, Chc2) → IE2Element(AlphSq, Chc3) → AlphNormal(Mu1, SE, Xc) → PrbLfIf(Chc2 ≟ 2, PrbLf, If[Chc2 ≟ 1, PrbRt, PrbTT]) → PrbIf(Prb < 0.001, "less than 0.001", If[Prb > 0.999, "more than 0.999", ("about " * Prb)]) → PrbTxIf(Prc < 0.01, "less than 0.1%", If[Prc > 99.9, "more than 99.9%", (("about " * Prc) * "%")]) → PrcTxIf(Chc2 < 3, ((" is " * Xc) * "."), (((("s are " * Xcl) * " and ") * Xcr) * ".")) → CVTx