
Histogram Reflex Game
Loading the math board and drawing, please wait…
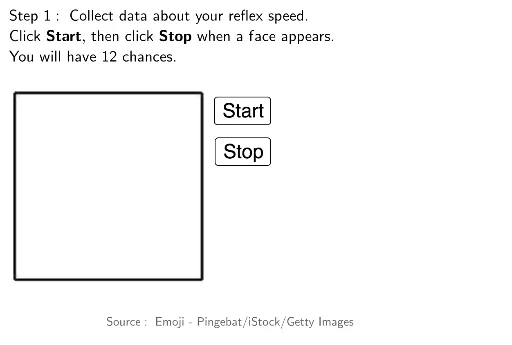
This example demonstrates a histogram reflex game involving histograms and symmetry. Using GeoGebra commands such as Histogram, Segment, and Polygon, it constructs histograms for reaction practice. Suitable for middle school students learning about histograms.
GeoGebra Commands & Parameters
Sort(RemoveUndefined[A1:A100]) → ValuesFrequency(Bins, Values) → FreqListMax(FreqList) → maxyLength(Values) → numvalsElement(Values, numvals) → maxvalElement(Values, 1) → minvalTextfield(usertext) → InputBox1Sequence((i, 0), i, minval, minval + (numbins * binwidth), binwidth) → TickMarksSequence(0, maxy, ygap) → yValsSequence((minval - binwidth / 2, i), i, Min[yVals], Max[yVals], ygap) → yTickMarksSequence(Text[Element[yVals, i], Element[yTickMarks, i] + (ylabhshift, ylabvshift)], i, 1, Length[yVals]) → yLabelsElement(Times, 1) → A1Element(Times, 2) → A2Element(Times, 3) → A3Element(Times, 4) → A4Element(Times, 5) → A5Element(Times, 6) → A6Element(Times, 7) → A7Element(Times, 8) → A8Element(Times, 9) → A9Element(Times, 10) → A10Element(Times, 11) → A11Element(Times, 12) → A12Element(Times, 13) → A13Element(Times, 14) → A14Element(Times, 15) → A15RotateText(LaTeX["\text{Frequency}"], π / 2) → yAxisLabelHistogram(Bins, Values, false) → HGramSequence(Text[Element[Bins, i], Element[TickMarks, i] - (xlabhshift, xlabvshift)], i, 1, 100) → xLabelsSequence(Segment[(x(StartingPt), y(StartingPt) - (i * Height)), (x(StartingPt) + Width, y(StartingPt) - (i * Height))], i, 0, 13) → SegmentsSegment(StartingPt, BotPoint) → fSegment(StartingPtRight, BotPointRight) → gPolygon(StartingPt, Pt1, Pt2, StartingPtRight) → q1, startingpt, pt1, pt2, startingptrightLaTeX("Times\\ \ \\" + (Element[Times, 1]) + "\\\ \\" + (Element[Times, 2]) + "\\\ \\" + (Element[Times, 3]) + "\\\ \\" + (Element[Times, 4]) + "\\\ \\" + (Element[Times, 5]) + "\\\ \\" + (Element[Times, 6]) + "\\\ \\" + (Element[Times, 7]) + "\\\ \\" + (Element[Times, 8]) + "\\\ \\" + (Element[Times, 9]) + "\\\ \\" + (Element[Times, 10]) + "\\\ \\" + (Element[Times, 11]) + "\\\ \\" + (Element[Times, 12]) + "") → TextMax(1, floor(numbins / 25)) → labelfreqSegment((minval - binwidth / 2, 0), (minval + (numbins * binwidth), 0)) → xaxisSegment((minval - binwidth / 2, 0), (minval - binwidth / 2, maxy)) → yaxis
AI Drawing Prompt Reference
Create a histogram for reaction practice. First, generate a histogram based on a set of data values, with appropriate bins, and display the frequency. The histogram should include an x-axis, y-axis, histogram bars, and labels for each bar. The x-axis should range from the minimum value to the maximum value, and the y-axis should range from 0 to the maximum frequency. Each bar's height should correspond to the frequency of data in that bin.
The prompt above was compiled from the original drawing commands and is for reference only.