
H2M L15 Q5: Integrated Exploration of Binomial Distribution and Differential Equ
Loading the math board and drawing, please wait…
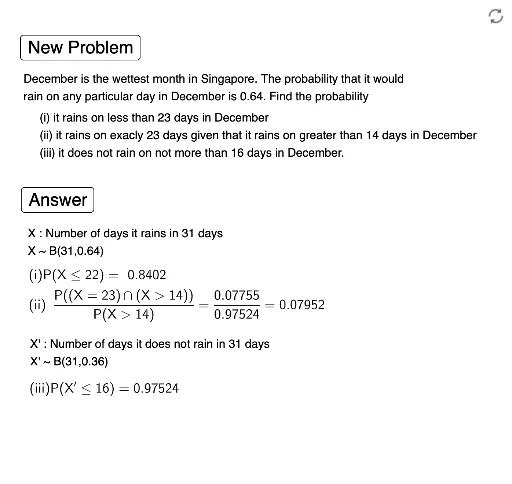
① This example is a comprehensive math exercise that dynamically demonstrates the interplay of binomial distribution, differential equations, quadrilaterals, equations, optimization problems, and perimeter using GeoGebra. ② Core mathematical concepts include probability calculation with binomial distribution, modeling and solving differential equations, geometric properties of quadrilaterals, equation solving, optimization, and perimeter computation, reflecting integrated knowledge across chapters. ③ Construction highlights: Based on the construction summary, commands such as Random, If, BinomialDist, and ScientificText are used, along with multiple buttons (button1, button2) and text objects (text1 to text10), variables (a, b, c, d1, d2, d3, p, n, o, x1, x2, x3), and intermediate objects (i, ii, ii1, ii2, iii, iii1) to enable interactive parameter control and result display. ④ Suitable for high school or pre-university students to review and consolidate applications of probability, calculus, and geometry, and also useful for teacher demonstrations or student self-exploration.
GeoGebra Commands & Parameters
Random(1, 2) → d3Random(13, 15) → bRandom(1, 2) → d1Random(b + 2, b + 2) → cRandom(17, 24) → aRandom(31, 31) → nRandom(1, 2) → d2If(d1 ≟ 1, "less than", "at most") → text2If(d1 ≟ 1, a - 1, a) → x2If(d2 ≟ 1, "at least", "greater than") → text3If(d2 ≟ 1, b - 1, b) → x1BinomialDist(n, p, x2, true) → iBinomialDist(n, p, a, false) → ii2If(d3 ≟ 1, c, c - 1) → x3BinomialDist(31, 1 - p, x3, true) → iiiScientificText(iii, 4) → iii1If(d3 ≟ 1, "not more than", "lesser than") → text6If(d2 ≟ 1, "≥", ">") → text10
AI Drawing Prompt Reference
Draw a binomial distribution probability graph with n=31 and p as a random value. Adjust c based on the value of d3, setting x2 to a-1 or a. Set x1 to b-1 or b based on the value of d2. Calculate the binomial distribution probability using these parameters and display the result. Adjust x3 based on the value of d3, setting x3 to c-1, calculate another binomial distribution probability, and display the result.
The prompt above was compiled from the original drawing commands and is for reference only.