
H2M 2019 P2 Q9 Math Example
Loading the math board and drawing, please wait…
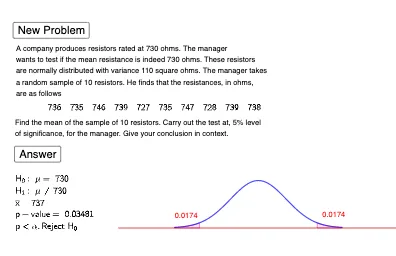
This example demonstrates a mathematical problem combining hypothesis testing with geometric figures (e.g., pyramids, trapezoids). Key concepts include hypothesis testing, secant lines, real numbers, and polygon perimeter calculations. GeoGebra commands like InverseNormal, Random, Sequence, Shuffle, mean, Normal, Integral, If, and TableText are utilized in construction. Suitable for high school mathematics education and learning, integrating statistics and geometry.
GeoGebra Commands & Parameters
InverseNormal(m, s / sqrt(n), 1 - a) → z1Random(10, 12) → dmSequence(z11 + Random[1, dm], i, 1, n / 2) → l1Sequence(z11 + z11 - Element[l1, i], i, 1, n / 2) → l2Shuffle(Join[{l1, l2}]) → l3, {736, 735, 746, 739, 727, 735, 747, 728, 739, 738}mean(l3) → m1Normal(0, 1, x, false) → fNormal(m, s / sqrt(n), m1, true) → p1Integral(f, z2, Infinity) → bIntegral(f, -Infinity, (-z2)) → cIf(p2 > a, "p > α, Do\ not\ reject", "p < α, Reject") → text1Integral(f, z2, 3) → dIntegral(f, -3, (-z2)) → eTableText(l3) → text9
AI Drawing Prompt Reference
Create a histogram of 10 randomly generated normal distribution values based on a normal distribution with mean 735.5, standard deviation 10.5, and sample size 10. Calculate the mean of these values and generate a new set of values. Plot the normal distribution curve, calculate and label the probabilities for two specific intervals, and determine whether to reject the null hypothesis based on the given significance level a.
The prompt above was compiled from the original drawing commands and is for reference only.