
Week 4 - Statistics
Loading the math board and drawing, please wait…
In collections
Length, Area, & Volume MAT 6715 by Laura Anderson
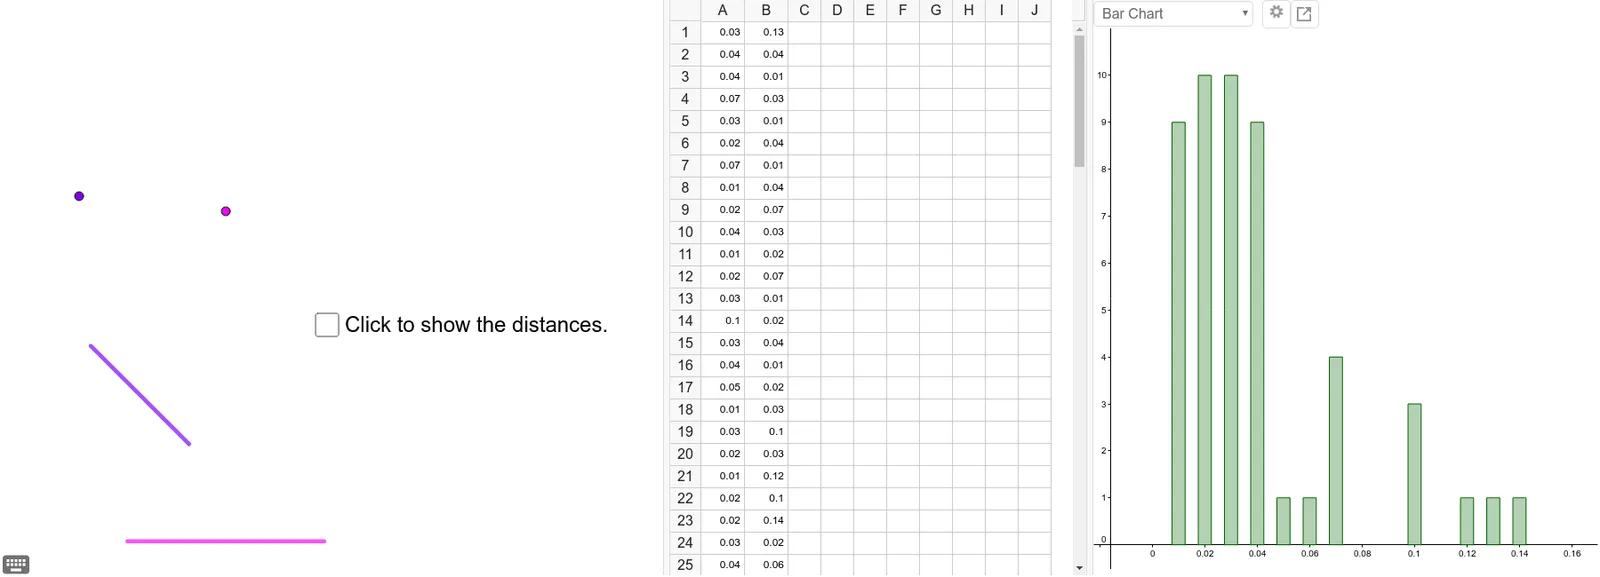
This example demonstrates frequency distribution plotting and data analysis in statistics. Core concepts include frequency distribution, definite integral calculation, and points/lines in coordinate systems. Construction involves commands like Segment, Point, Distance, creating objects such as A, B, C, D, f, g, and auxiliary points E, F, G, H, with distance variables d_x, d_y. Suitable for high school and above learning statistical applications and calculus.
GeoGebra Commands & Parameters
Segment(A, B) → fSegment(D, C) → gPoint(f) → GPoint(g) → HDistance(G, E) → d_xDistance(H, F) → d_y
AI Drawing Prompt Reference
Draw line segments AB and CD in a coordinate system, label them as f and g respectively. Mark a point G on line f and a point H on line g. Measure the distance from G to auxiliary point E and label it d_x, and measure the distance from H to auxiliary point F and label it d_y, showing the relationships between these points and distances.
The prompt above was compiled from the original drawing commands and is for reference only.